How to Use MGI
This document is intended to help users interpret and navigate many of the functions
available in MGI. If you have not worked with model organisms before, you may also find
the
Introduction to Mouse Genetics a helpful resource for terminology and the basics of
using mice in an experimental genetic context.
MGI is a comprehensive, authoritative and curated international database resource, designed
to provide free access to integrated genetic, genomic and biological data gathered from the
greater research community. Data is derived from curation of the primarily literature, direct
submission by researchers or research projects, and through data loads from other public
resources. Each piece of information in MGI is associated with its source, indicated by a J:#.
Within MGI, information is not merely presented as described in a publication, but organized, integrated,
and translated into metadata using standardized structured vocabularies. These well-defined
terms can be used to annotate (or retrieve) information at whatever level of precision has
been investigated or is desired, associate similar observations to one another, and provide information on
relationships between terms. Importantly, they are also stable, unique and can be parsed by a
computer for bioinformatic analyses. Three major structured vocabularies, also known as
"ontologies", are developed and used by MGI: the Mammalian Phenotype
ontology which describes abnormal observations in mutant animals, the
Gene Ontology (GO) which describes the normal behavior of a gene or gene product within
it's cellular context, and the
Mouse Developmental Anatomy ontology which describes mouse anatomical structures throughout
development, used for annotation of gene expression and cre recombinase activity results.
There are three primary ways in which users can access data from MGI:
- By using the Quick Search and following links for individual genes and alleles
- By using built-in query forms to generate lists
- Through bulk data access or with batch tools
Video Tutorials
- Introduction to Mouse Genome Informatics
- cre-lox and cre recombinases in MGI
- The Human-Mouse: Disease Connection in MGI
- MouseMine computational access to MGI data
Video Module 1. An Introduction to Mouse Genome Informatics
Download slides (if desired) by clicking the SlideShare footer from the frame on the right.
Video Module 2. cre-lox and cre recombinases in MGI
Download slides (if desired) by clicking the SlideShare footer from the frame on the right.
For additional background on conditional alleles and the cre-lox system, see here
or here.
Module 3. The Human-Mouse: Disease Connection at MGI
The Human–Mouse: Disease Connection (HMDC) is found
here.
A written tutorial appears on the HMDC home page under
"Take a tour of the Human–Mouse: Diseases Connection"
Download slides (if desired) by clicking the SlideShare footer from the frame on the right.
MouseMine computational access to MGI data
See just above on this page to access MouseMine.
Download slides (if desired) by clicking the SlideShare footer from the frame on the right.
1. How to locate gene or allele specific information
To access all of the data in MGI about a specific gene, you can simply enter the gene
symbol, name, or synonym into the Quick Search window near the top of every MGI page.

|
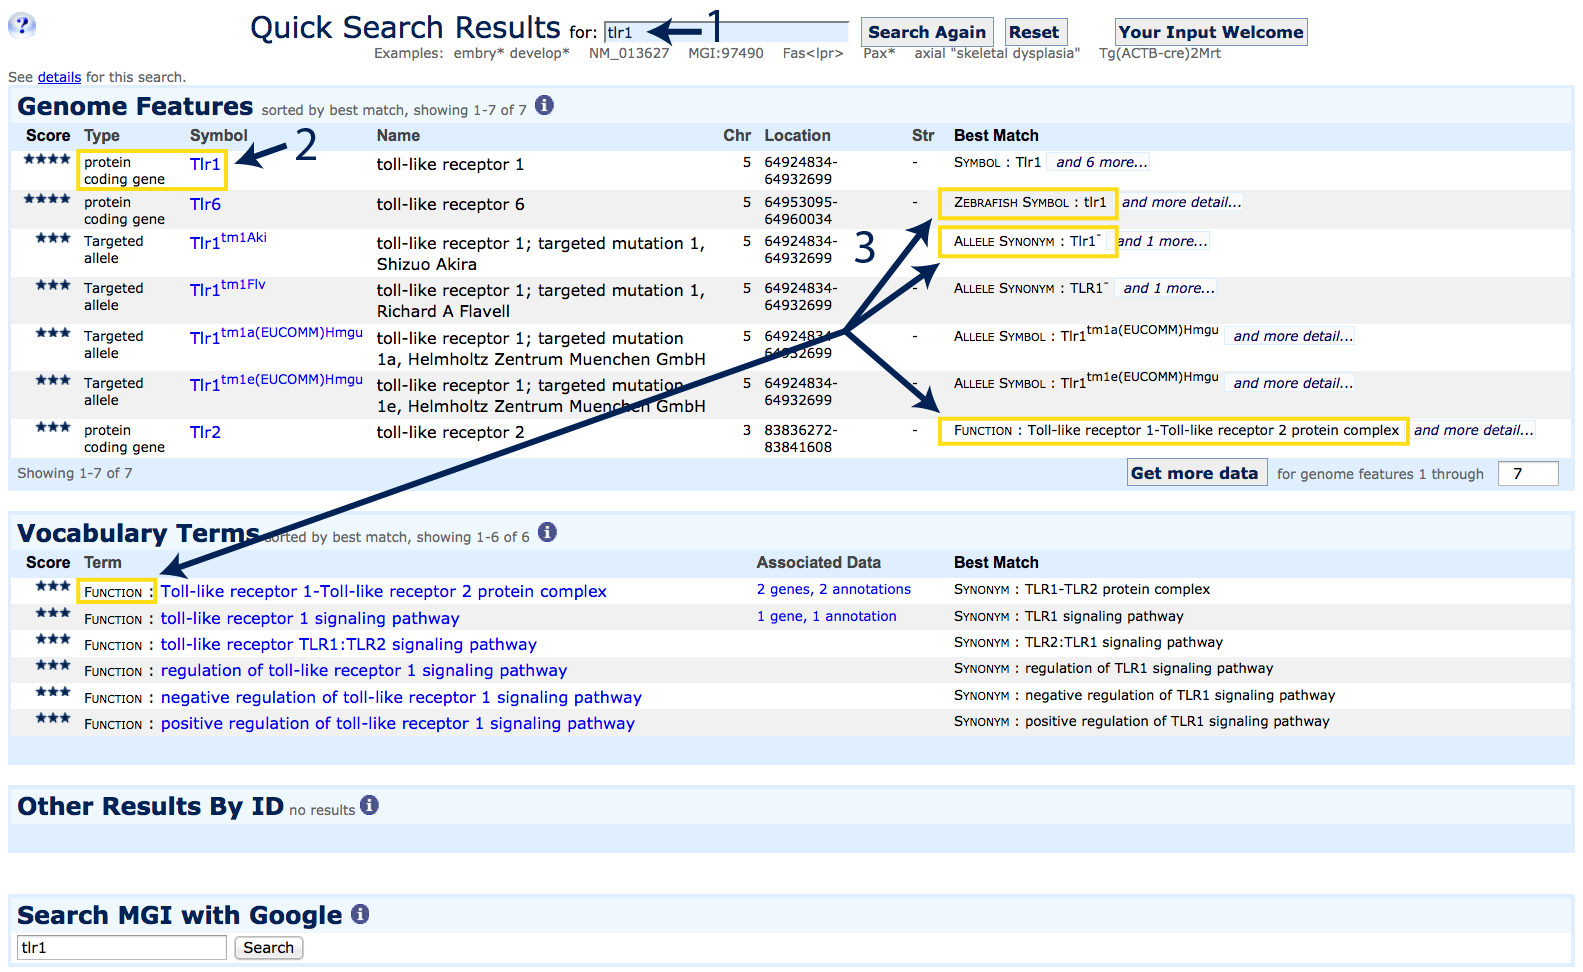
Results are ranked by how well they match the search input. In this example
- The gene symbol Tlr1 was used as a search term. This search is not case sensitive;
use an asterisk (*) as a wildcard for broader searches
- The highest scoring match is to the protein-coding gene Tlr1
- Additional possible matches are returned including Tlr6, as the
zebrafish ortholog uses Synonym:
Tlr1 as its official gene symbol, several targeted allele
variants of the Tlr1 gene (see
Allele Synonym and
Allele Symbol under the Best Match column), and an
annotation to Function:
TLR1-TLR2 protein complex.
Click on the hyperlinked gene symbol for
Tlr1 (indicated by the #2) to go to a Gene Detail Page.
|
2. Gene Detail Pages
|
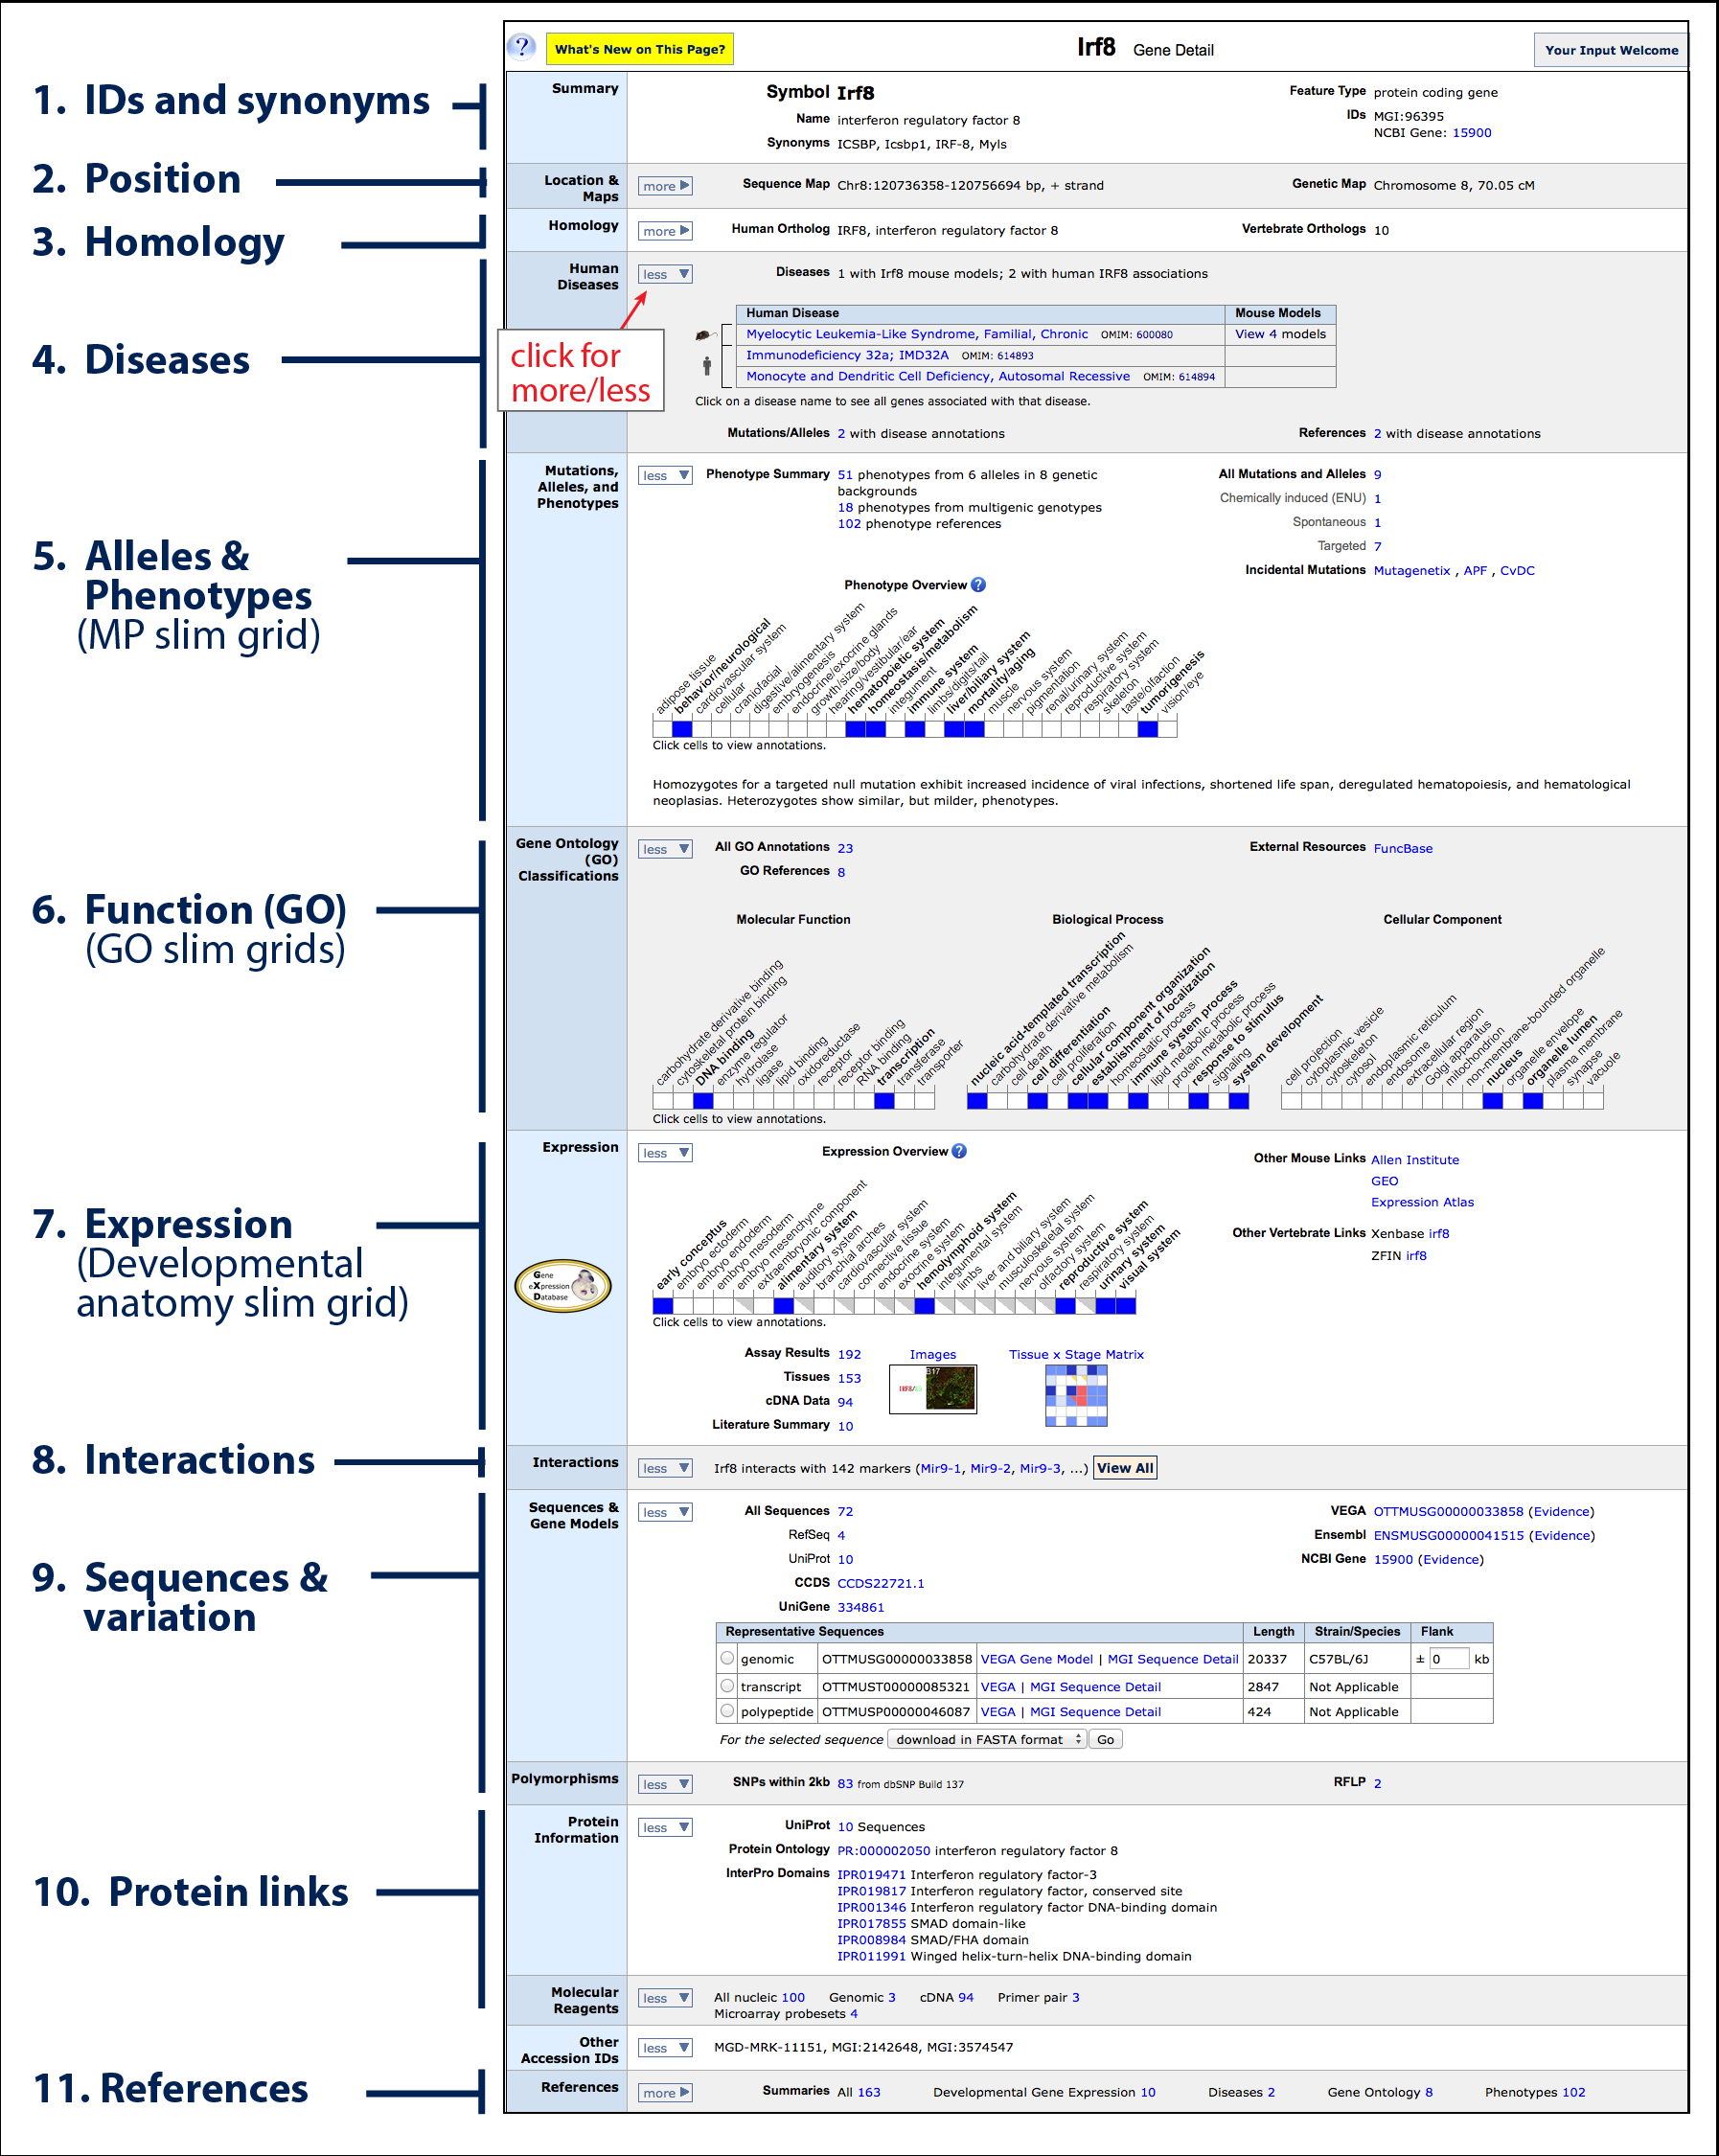
There is a wealth of information and links to be found on Gene
Detail pages. The gene detail page for
Irf8 is shown on the left. Each row contains information and links to a particular data
type associated with this gene. Some rows are open by default, while others are closed with additional
information available. Click "more"
( )
and "less" ( )
and "less" ( ) arrows within the row
to change the display. ) arrows within the row
to change the display.
- IDs and synonyms: the official gene or marker symbol is presented
at the top of the page with any synonyms below, along with its unique
MGI ID.
- Position: chromosomal position in both physical
(bp) and linkage (cM) coordinates (where known/applicable).
Expanding this section will reveal interactive browser maps including
the
Mouse Genome Browser and links to other commonly used tools (Vega, Ensembl,
UCSC and NCBI).
- Homology: Identifiers
and links to sequences for homologous genes (i.e. related by descent from a common ancestral
sequence) in other vertebrate species.
- Diseases: Default closed, shown open. Indicates
whether mutations in this gene have been described (by OMIM) as involved in human
clinical disease (human icon) and/or been described as a mouse model
of a human disease (mouse icon).
- Mutations, alleles and phenotypes: a
brief text summary of the phenotypes observed in mice carrying
spontaneous or targeted mutations at this gene, an interactive slim grid of
27 major physiological systems with blue indicating a phenotypic annotation,
and a summary of all mutant alleles that have been generated and/or described by the
scientific research community. See also the section on
Allele Detail pages.
- Gene Ontology (GO) Classifications: a triplet of
interactive slim grids where information about this gene (or gene product)'s molecular function,
biological processes and cellular component are featured. Blue indicates that an
annotation within this gene ontology category has been recorded.
- Expression: an interactive slim grid highlighting
anatomical systems where this gene is expressed. These data, including
supporting images where available, are curated by
the Gene Expression Database.
- Interactions: a list of microRNAs that
that have been validated or predicted to interact with this genome feature.
On miRNA gene pages, the list of genome features that miRNA interacts
with will be displayed.
- Sequences: links to download genomic, transcript or protein
FASTA sequences. Polymorphic variants reported between inbred strains
are linked in the row below.
- Protein links: protein domain information provided by InterPro
- References: a list of all references curated by MGI for this gene.
|
Homology
|
The Homology ribbon is closed by default. Click the
more/less button to expand and see more detail.
MGI loads homology assertions from both NCBI
HomoloGene and the
HCOP/HUGO Gene Nomenclature Committee. Species
represented include mouse (Mus musculus), human (Homo sapiens), rat
(Rattus norvegicus), chimpanzee
(Pan troglodytes), Rhesus macaque (Macaca mulatta), dog
(Canis familiaris), cattle (Bos taurus), chicken (Gallus
gallus), zebrafish (Danio rerio) and western clawed frog
(Xenopus tropicalis).
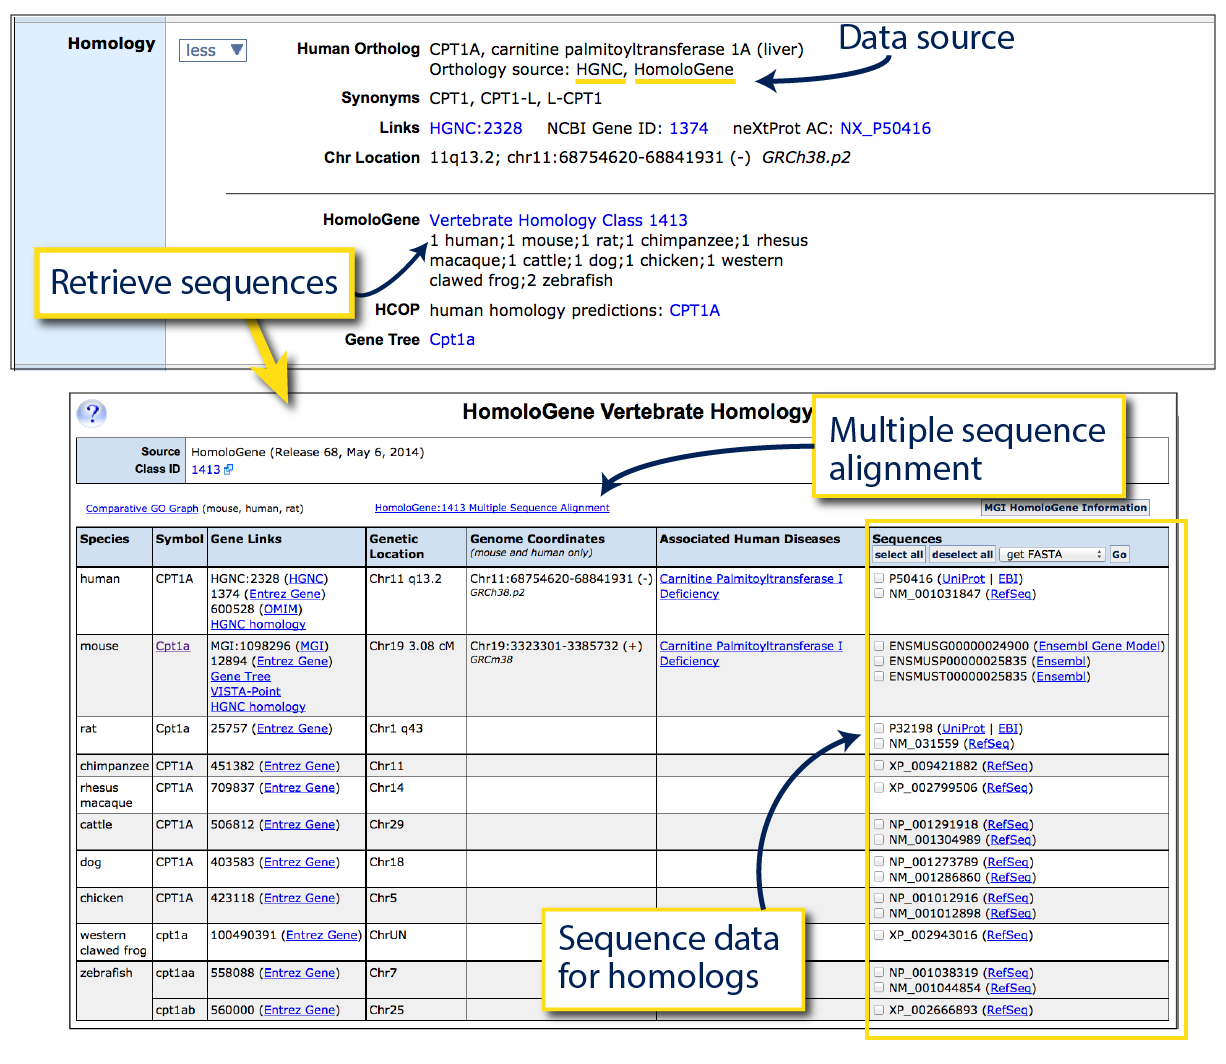
To the right, see homology information for Carnitine
palmitoyltransferase 1a, liver
(Cpt1a).
The human ortholog, CPT1A, is displayed at the top of this section, together with any human
gene synonyms, external IDs and positional information. Homology assertions displayed in MGI
are always sourced, either to HomoloGene, HGNC or both (as in this case).
HomoloGene is an automated system for constructing homology classes across
complete genomes of many species, while HGNC is focused on human as the primary species
of interest and combines several automated pipelines together with curator decisions.
See their respective pages (linked above) for more information.
Below, see vertebrate homologs and retrieve sequences across all represented species by clicking on the
hyperlinked homology class ID. Homologs may be ‘1:1’, ‘1:many’ or ‘many:many’. In this example,
mouse Cpt1a has a 1:1 homology relationship with human CPT1A, but
a 1:2 relationship with zebrafish cpt1aa and cpt1ab (paralogous duplication).
The last column on this table allows you to download FASTA sequences for homologous protein (NP or UniProt links)
and mRNA transcript sequences (NM links). To view a Multiple Sequence
Alignment (protein level), click the link indicated above the table which links
out to NCBI tools.
[Return to Gene Detail]
[Return to Table of Contents]
|
|
Disease
|
The Disease ribbon is closed by default. Click the
more/less button to expand and see more detail.
MGI provides curated gene-to-disease relationships for both human and mouse in cases
where that relationship is well supported. For human, we load these relationships from
data curated by Online Mendelian Inheritance in Man (OMIM) staff. For mouse,
MGI curators rely on explicit, traceable author statements that a particular mouse mutant
is a model for a given human disease.
To the right, see the disease table for
Kras.
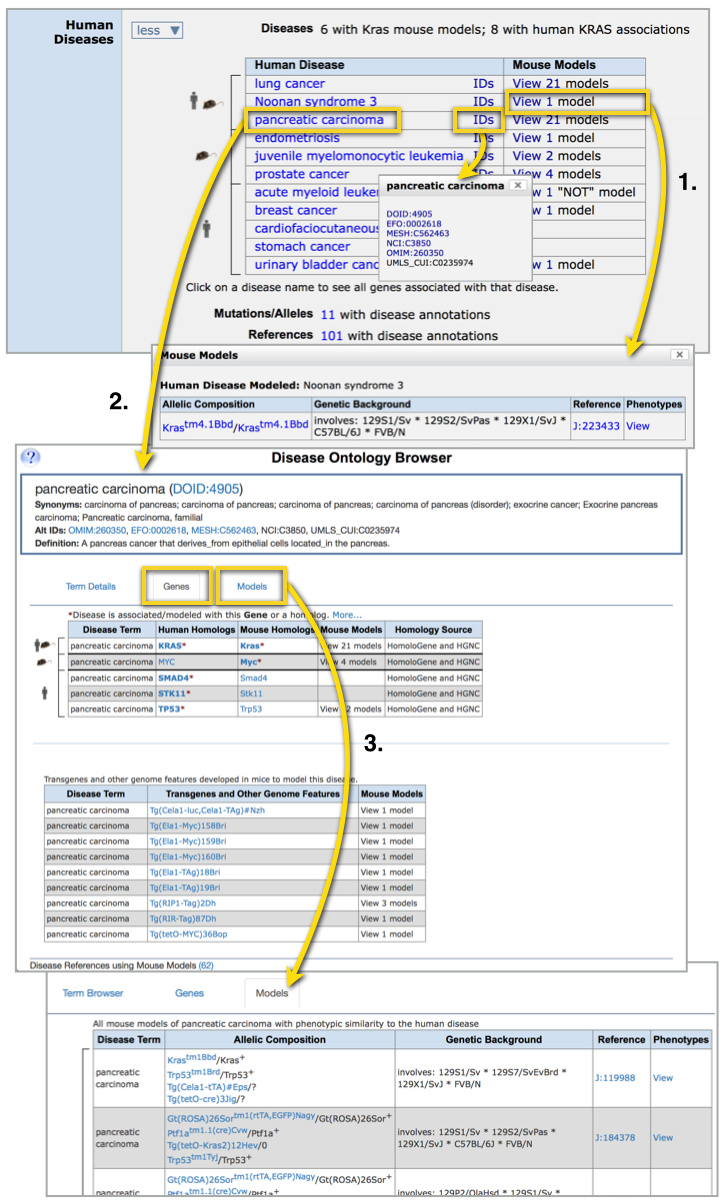
If mutations in a gene have been described as causing disease in humans, a small human
icon will appear next to that row (ex. ‘KRAS-lung cancer’ and ‘KRAS-bladder cancer’).
If a mouse mutant has been described as a model of a human disease, a mouse
icon will appear (ex. ‘Kras-lung cancer’ and ‘Kras-prostate cancer’).
In many cases these will agree, and both icons appear together. When gene-to-disease
relationships appear in one species only, this often simply indicates missing data as a mouse
mutant may not been examined and described within this disease context, and/or
a human clinical case of the disease with mutations in this gene may not have been found and
curated (yet). If a mouse model was specifically examined for a disease and found
by researchers to not sufficiently reproduce the necessary equivalent phenotypes, the association will be
reported with a "NOT" qualifier (ex. ‘Kras-Leukemia, Acute Myeloid; AML’ - see
option to "view 1 NOT model" for details).
Click on the hyperlinked ‘view # models’ (#1) to view exactly which mouse genotypes have
been described as exhibiting the characteristics of a model for human disease (view 1
model for Noonan Syndrome 3). This pop-up will record the specific allele pair (i.e.
Krastm4.1Bbd; click to view the biological properties
associated with this mutation on the allele detail page), the mouse strain background, annotated phenotypes and the reference
describing this mouse as modeling the human disease indicated (J:#).
Click on the hyperlinked disease name (#2; pancreatic carcinoma
) to go to a Disease Ontology Browser page. The first tab 'Term Details' displays the parent, siblings, and child terms
for the searched term. Tables on the second tab 'Genes' include all genes that have been implicated
as causing that disease in human cases or mouse models. The third tab 'Models' (#3) shows the mouse strain background, annotated phenotypes and the reference
describing this mouse as modeling the human disease indicated.
[Return to Gene Detail]
[Return to Table of Contents]
|
|
Mutations, alleles and phenotypes
|
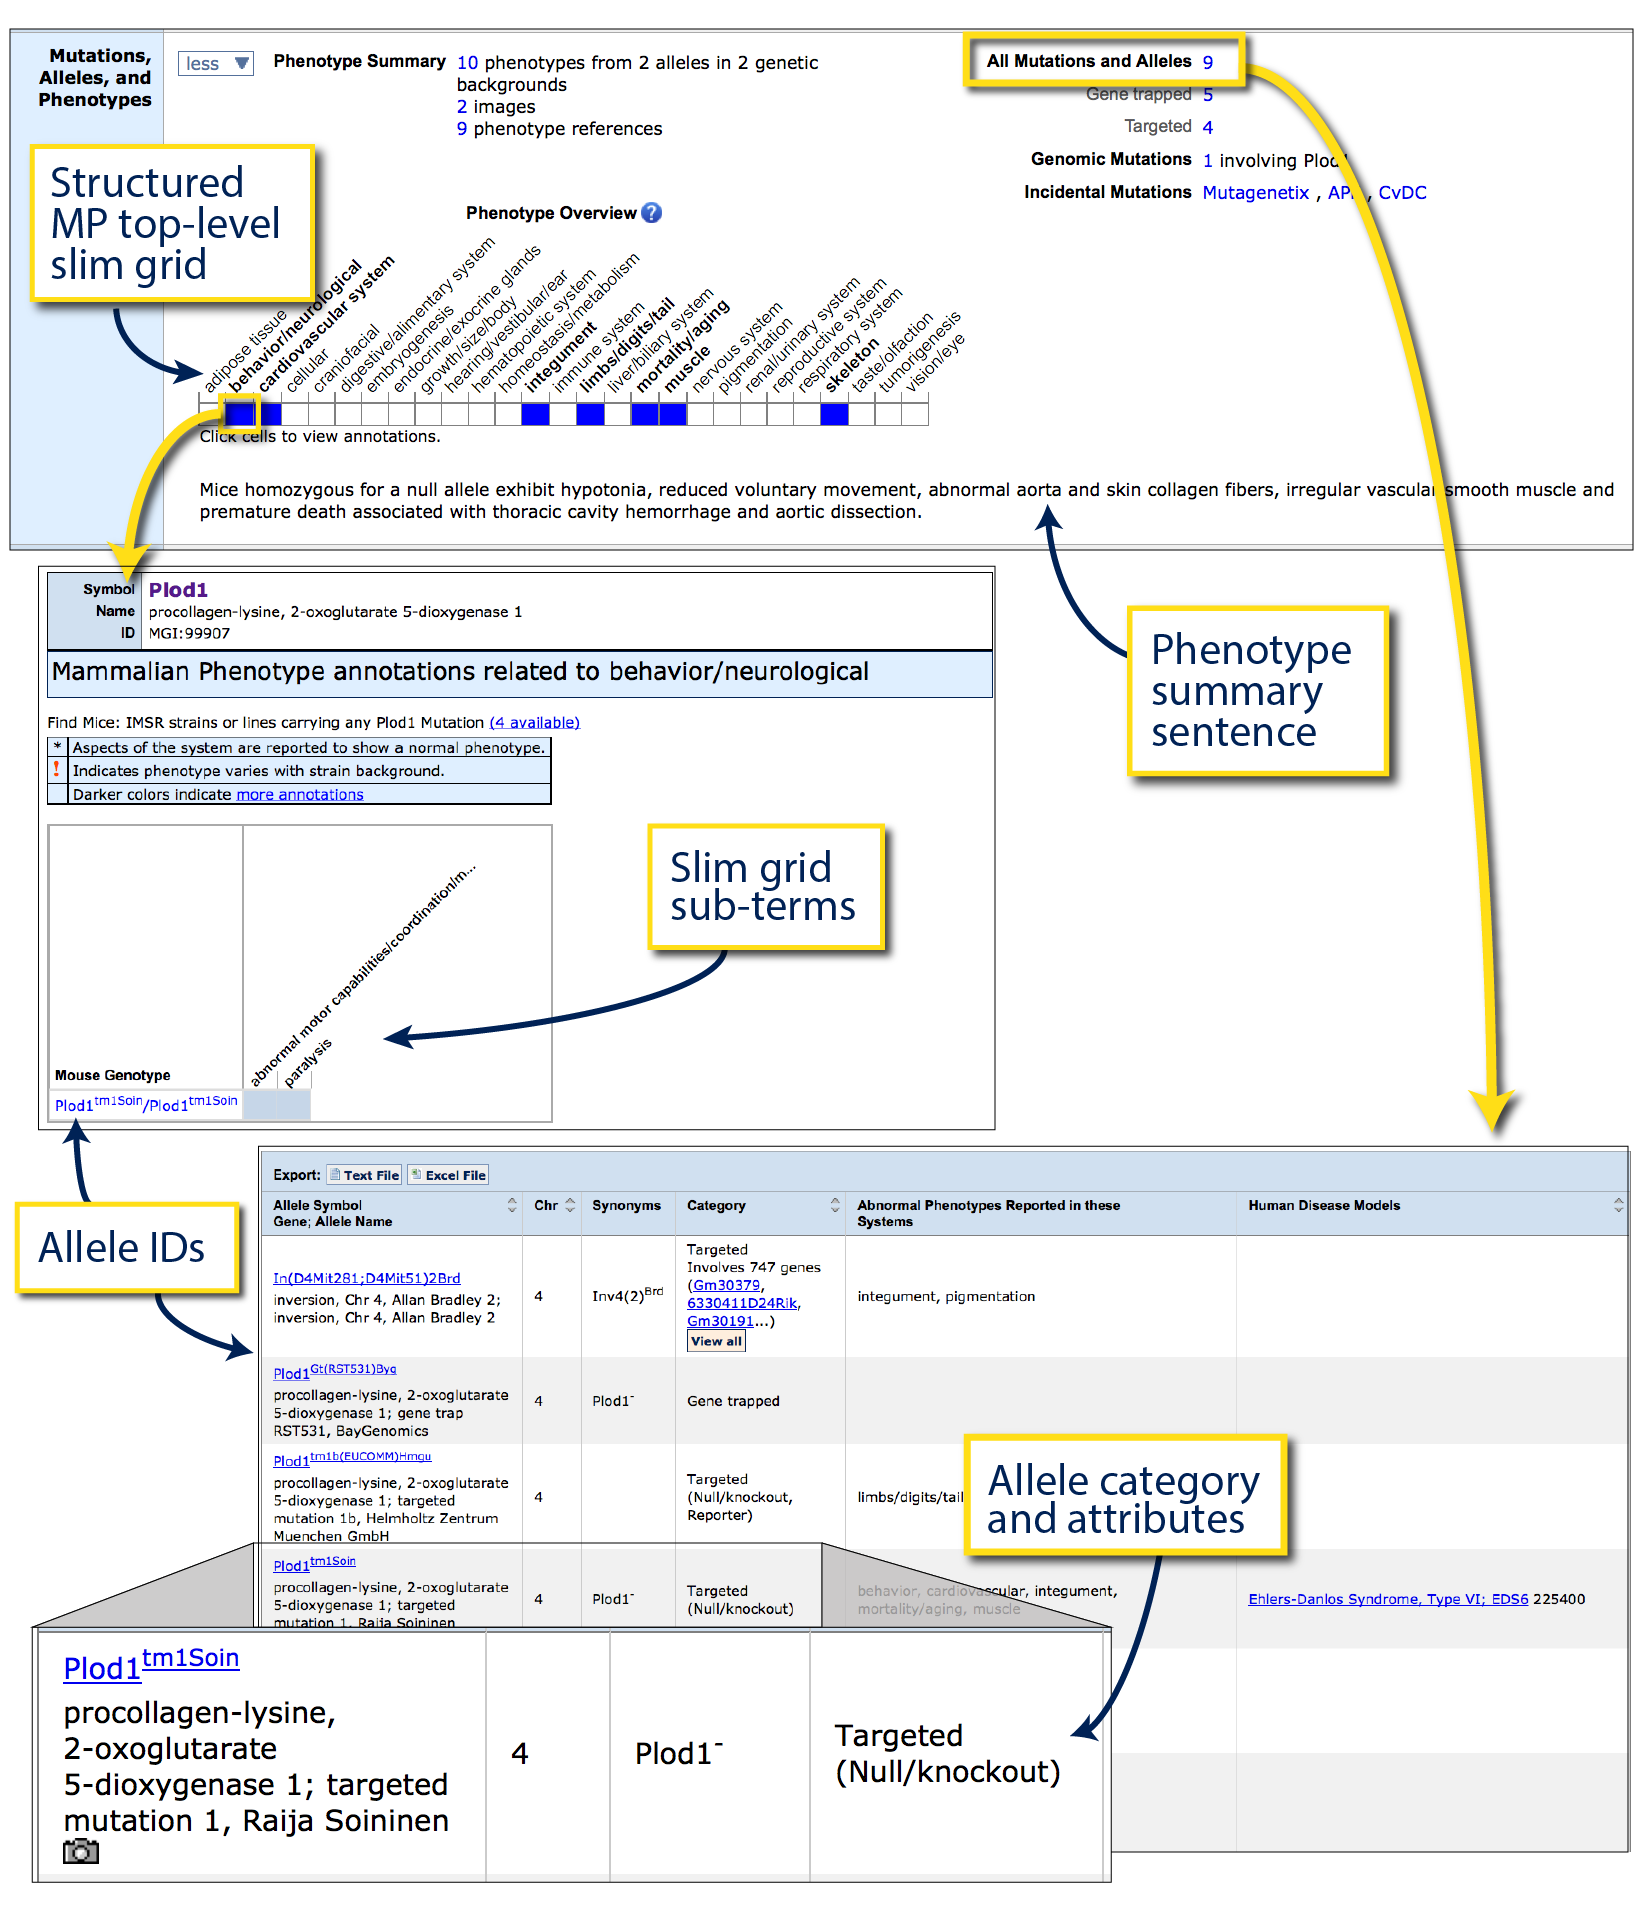
The Mutations, Alleles and Phenotypes ribbon on a gene detail page provides an at-a-glance
text and grid summary of the major phenotypes associated with mutations in this gene,
as well as links to all described alleles.
The example on the right shows the Mutations, alleles and phenotypes ribbon
for the
Plod1 gene.
Below the grid, a short sentence summary (Phenotype
summary sentence) is written by MGI curators to highlight
some of the more salient phenotypic observations.
The grid (Structured MP top-level
slim grid) lists all of major phenotypic systems comprising the
Mammalian Phenotype (MP)
ontology. Blue squares indicate that a phenotype within a given system can
been directly attributed to mutations/alleles of this gene, white squares
indicate that no annotations within this system have been recorded. Blue
squares are clickable (see arrow) which will generate a pop-up (Mammalian
Phenotype annotations related to [system]) describing which
alleles were used to make the annotation, and the specific phenotype terms that were
curated. These pop-ups are also clickable, and clicking on either allele IDs
(format: GenesymbolUniqueID) or
slim grid sub-terms will generate a genoview page (not shown) that includes curator comments
as well as the structured terms, and provides a reference for each observation.
This page can also be reached using the links in the Phenotype Summary above the
grid.
To locate a complete list of alleles that have been reported for this gene,
look to the top right corner of the ribbon where an All Mutations and
Alleles link appears, subdivided below by various relevant allele
generation types. See
Introduction to Mouse Genetics: Alleles for more information on the biology
differentiating these.
Clicking on these links (arrow) will open a new page for the
Phenotypic Allele Summary.
This table lists each allele with a unique ID in the first column, synonyms,
affected phenotypic systems for this mutant and the allele generation method
and attributes in the Category column. Clicking on an Allele Symbol
will bring you to an Allele detail page.
To purchase mice from commercial providers or public repositories,
see the Find Mice (IMSR) ribbon on Allele
Detail pages or navigate the International
Mouse Strain Resource database directly.
[Return to Gene Detail]
[Return to Table of Contents]
|
|
Gene Ontology (GO) Classifications
Gene Ontology (GO) uses a set of standardized, controlled
structured vocabulary terms to describe the function, biological process
involvement and cell component of gene products. GO for mice is developed
in collaboration with the Gene
Ontology project (see also
GO at MGI). Unlike the Mutations, Alleles and Phenotypes section
just above, GO describes the normal behavior of the gene or gene product within it's cellular
context, not abnormalities observed in mutants.
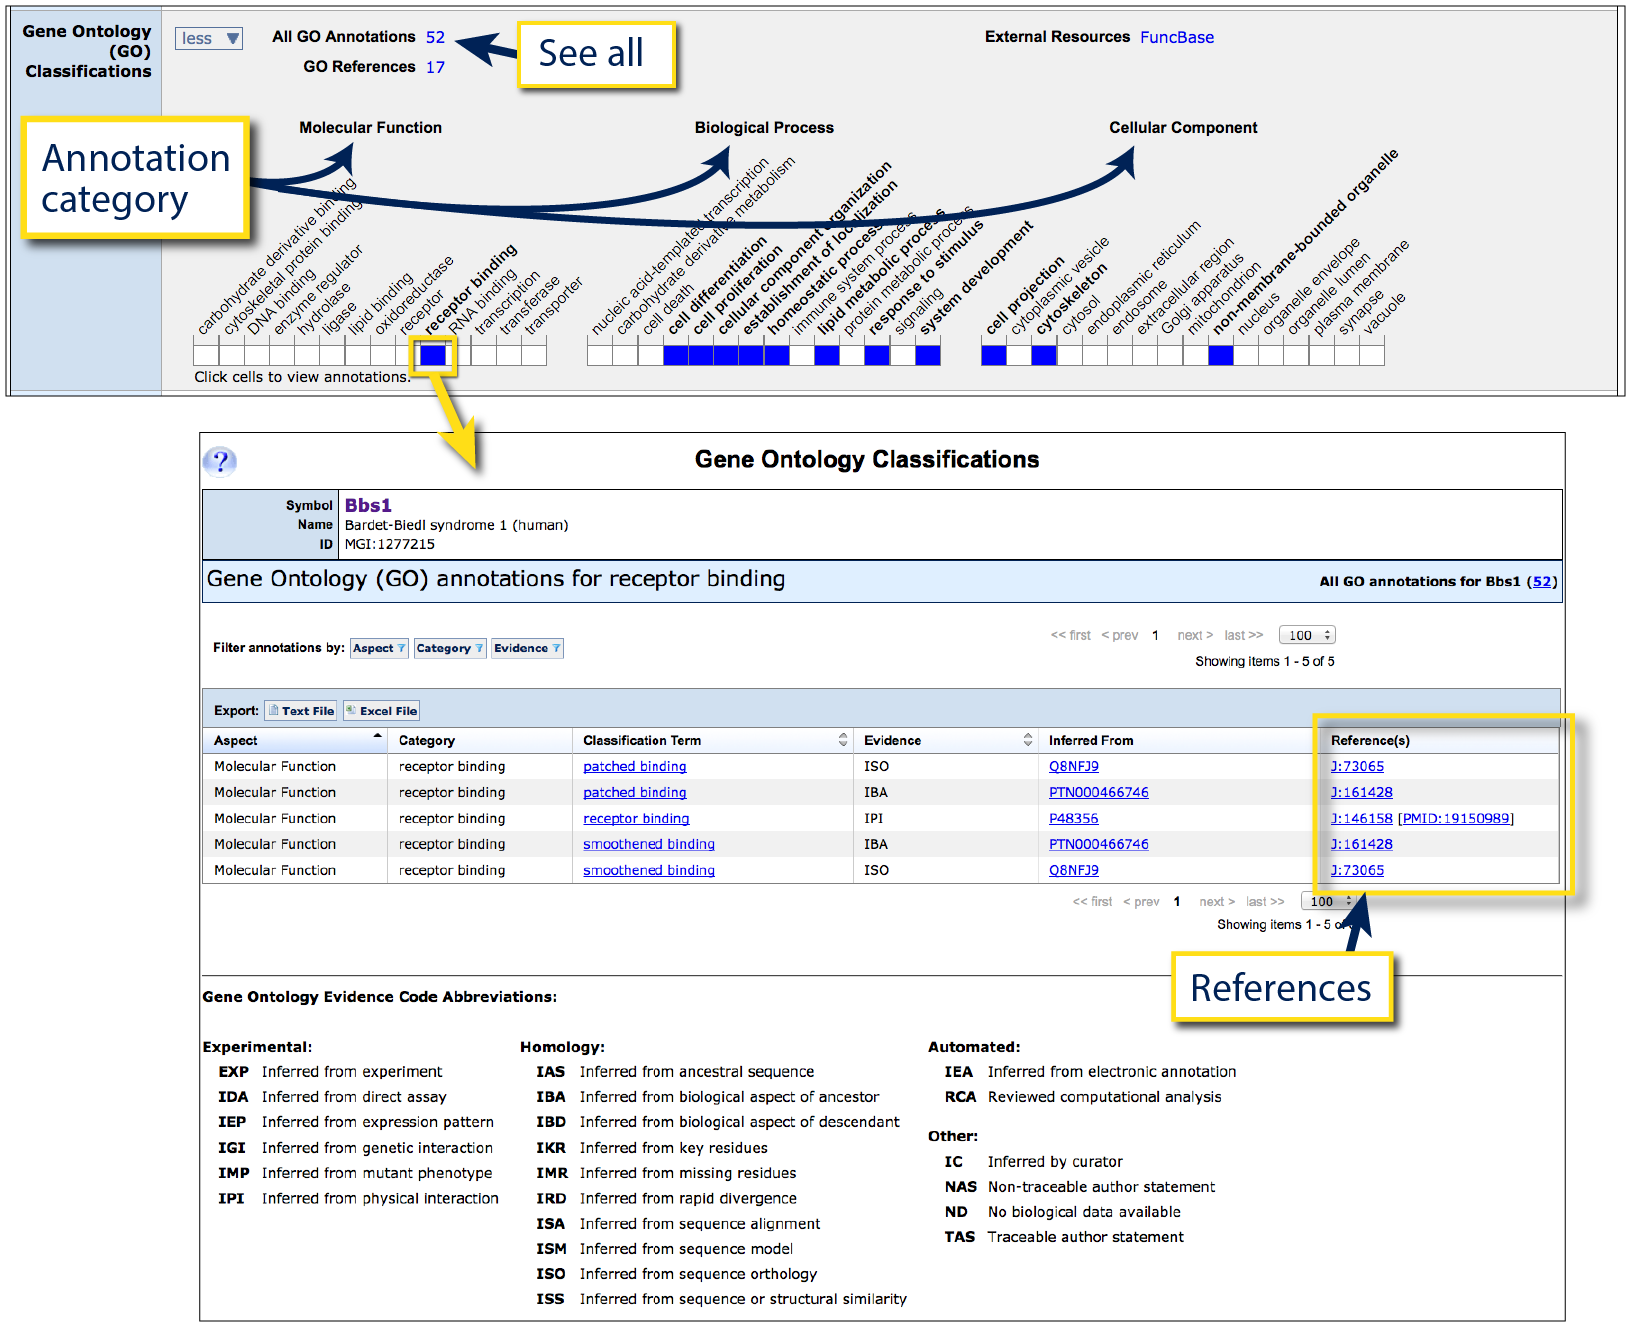
On the right is an example of the Gene Ontology (GO) Classification ribbon in
Bbs1.
This ribbon contains three grids chosen by GO to provide a broad representation of
all underlying data. Left grid is Molecular Functions
(elemental activities, such as catalysis or binding), center is
Biological Process
(a collection of molecular events forming a process pertinent to the functioning
of living things, such as signaling or metabolism), and the right grid for
Cellular component (the part of a cell or external environment where the gene product
is located).
Blue squares are clickable which will generate a new page with underlying data for
the intersection of gene and GO category, together with evidence and references (see arrow).
To retrieve the list of all vocabulary terms that have been annotated to this
gene, click on the hyperlinked number next to "All GO Annotations".
[Return to Gene Detail]
[Return to Table of Contents]
|

|
Expression
|
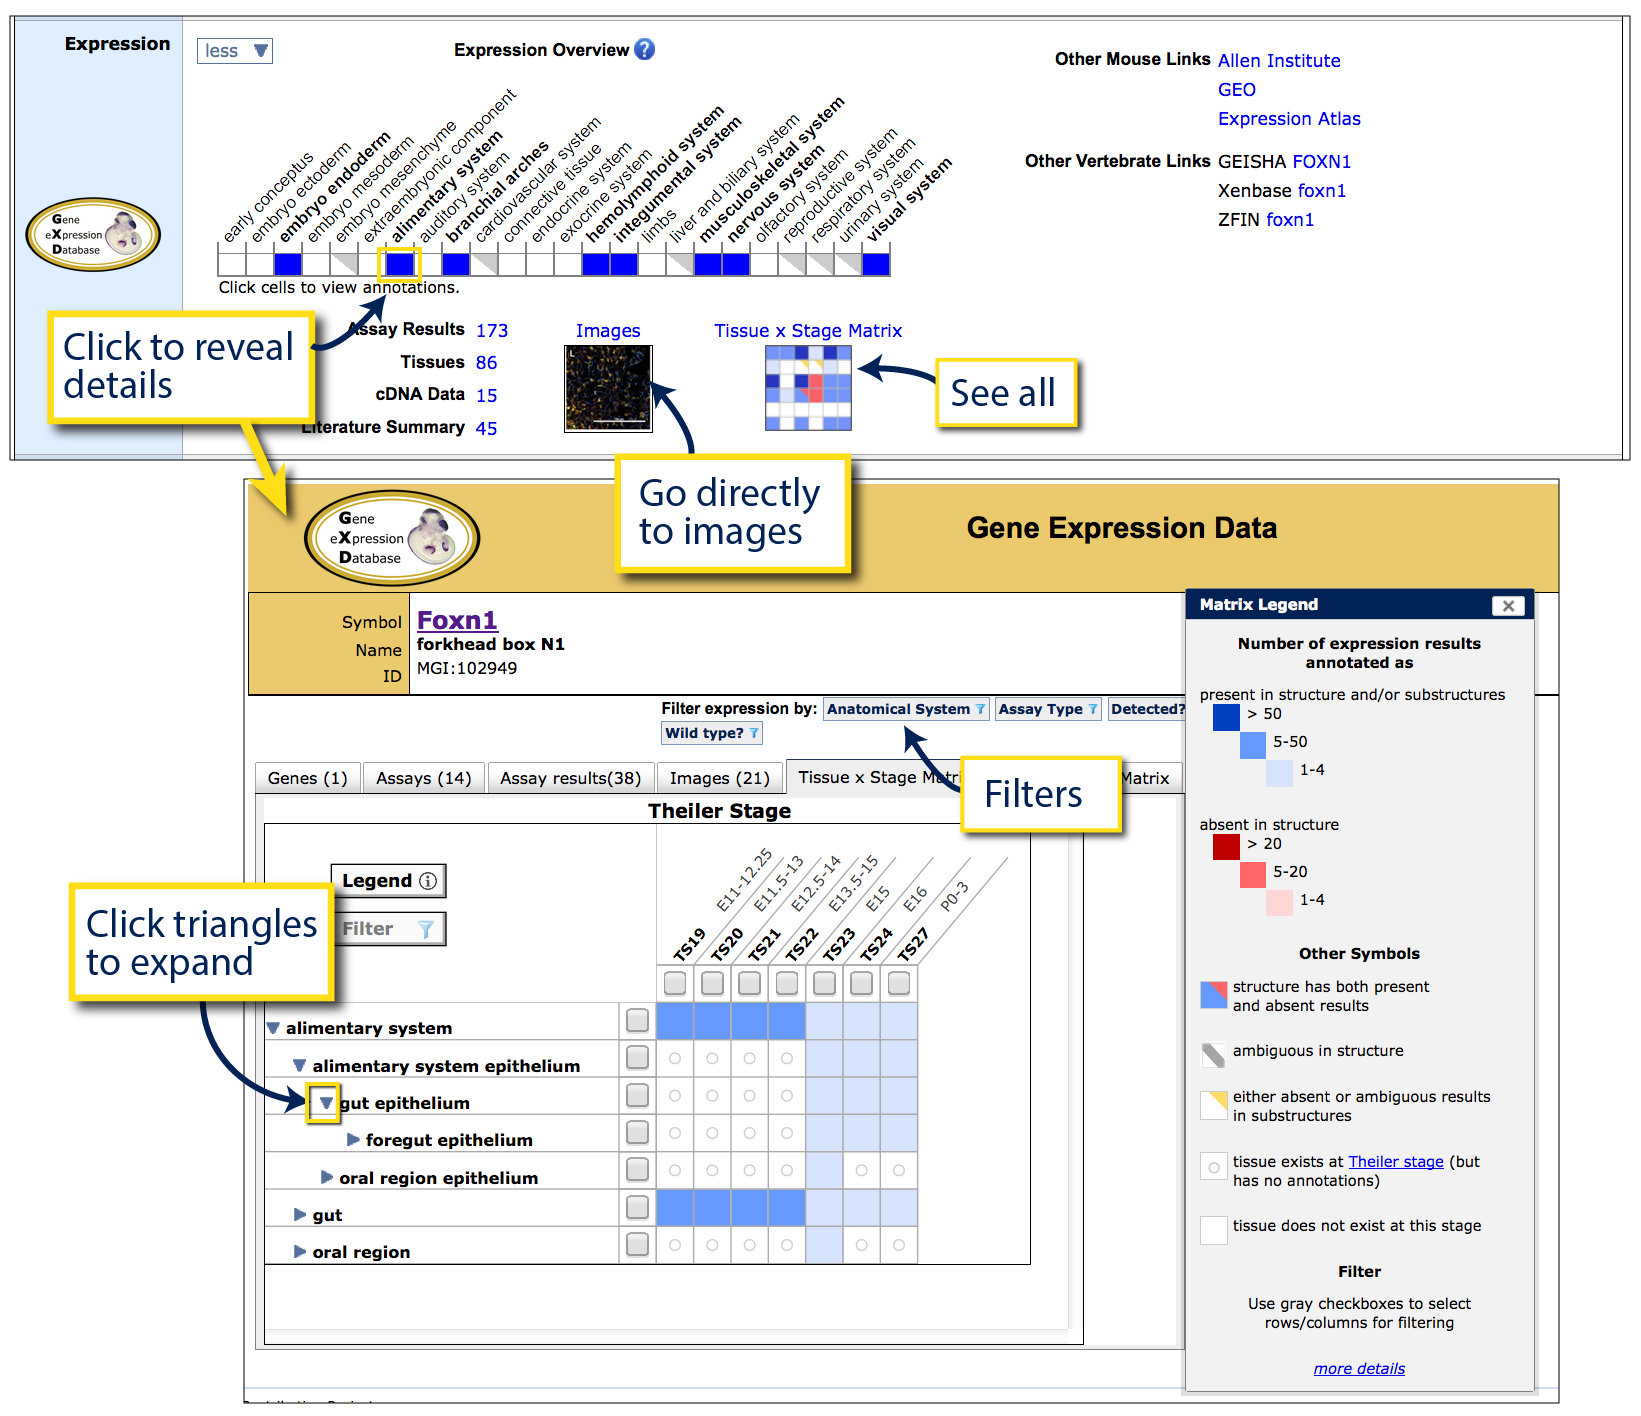
Expression of a gene can vary from ubiquitous to restricted by a particular
tissue type and/or developmental stage. In the gene Expression ribbon,
you can explore an overview of gene expression curated by the
Gene Expression Database, with a focus on endogenous expression during development.
The slim grid provides an overview of the major tissues and organ systems
present in a mouse across development based on the
Mouse Developmental Anatomy ontology.
To the right is the Expression ribbon for Foxn1.
Blue squares indicate that the gene is expressed in this system, grey triangles
indicate that all data system is derived from some other type of annotation, including
gene expression examined and absent, or expression data from mutant lines. White
indicates that no expression annotations are present within this system.
Filled cells (blue or grey) are clickable to reveal more detailed structures
and annotations (see arrow). On the Gene Expression Data page that appears,
a Tissue x Stage matrix appears with expression annotations arranged by tissue
in rows (use triangle toggles to retrieve more specific annotations) and developmental
stages displayed in columns. In this table, the TS prefix refers to Theiler stages
of embryonic development: TS1-TS26 are embryonic, TS27 is perinatal and
TS28 is adult.
A legend on this page outlines fill color and shading. Briefly, blue is used to
demonstrate that gene expression has been detected at a given tissue and stage, red
demonstrates that gene expression was examined and found to be absent, and gold indicates
tissue and stage combinations where the underlying annotations are negative or ambiguous, but
within substructures. Darker shading is used to indicate the presence of more data
but is not necessarily related to higher expression of the gene. If the intersection appears blank (white), there is no
expression data within GXD for that combination.
Apply filters to refine your
results, and click on shaded cells or navigate other tabs to see more specific
supporting data with references, images, or download data.
This page includes additional tabs, for more detail on interpreting each, see
How do I interpret the results of my expression search?
[Return to Gene Detail]
[Return to Table of Contents]
|
|
Interactions
|
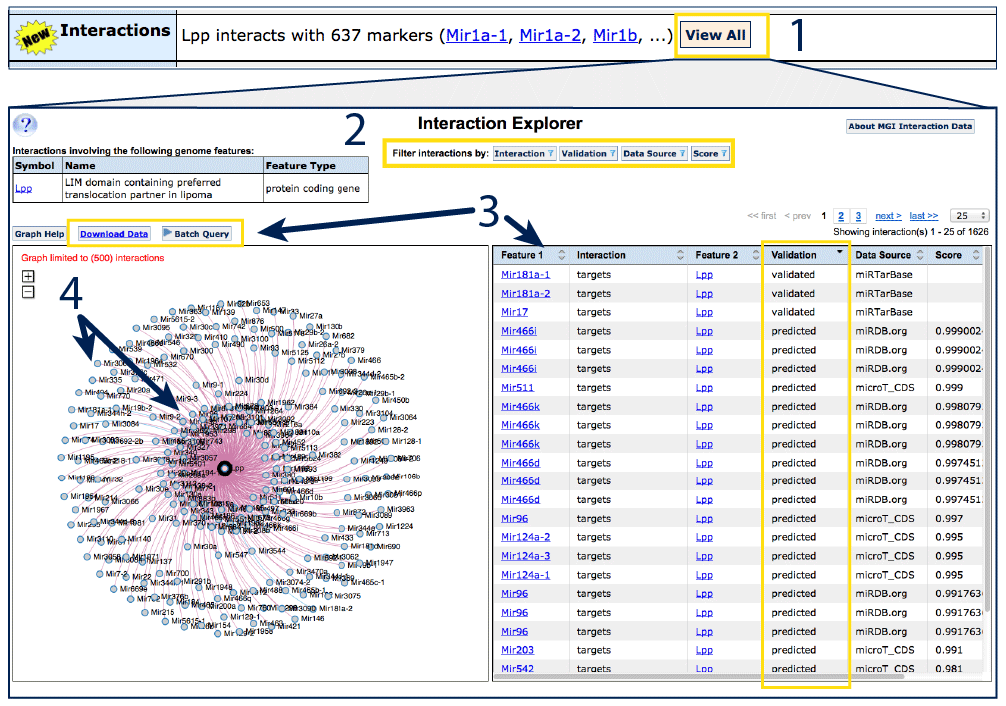
The interactions ribbon lists validated and predicted gene feature-microRNA
interactions loaded from
miRTarBase,
microt-cds, miRDB and
Pictar.
On protein coding gene detail pages, the microRNAs targeting the feature will
appear (see right for the protein coding gene
Lpp),
or, on microRNA gene detail pages (see Mir181a-2
for an example), the gene targets will be displayed. Click the View All
button (#1) to see all interactions in tabular
and graphic format in the Interaction Explorer.
The table lists the interacting features, the nature of the interaction, data
source and either a validated status or a prediction score, normalized
along a 0 to 1 scale. For more about prediction scores, see the About
MGI Interaction Data at the top right of the page. Columns may be sorted
using arrows in the header row, or apply filters using the options at the top
of the page (#2).
To download the entire dataset, use the Download data link (#3).
For table data, reflecting any filters that have been applied, use the
Batch Query button, which further allows you to add Gene Attributes
and Additional Information if desired, by expanding the Click to modify search
button that appears above the table on the linked page.
The hairball graphic (#4) can be used to
visualize the data in the adjacent table. Validated interactions are linked
with blue lines and predicted interactions with red lines. If a feature–feature
interaction has been reported from multiple data sources, it will appear in
the inner ring. Applying filters alters the graphic display as well as the
table.
[Return to Gene Detail]
[Return to Table of Contents]
|
|
2. Allele Detail pages
Variation at a gene is called an allele. MGI currently curates over
34,727 targeted or phenotypic alleles in mice, including spontaneous or induced mutations,
gene targeted alleles (knock-out, knock-in, floxed/FRT conditional), transgenes, recombinases,
and more. Each allele has a unique allele symbol which follows the guidelines for
mouse standard
nomenclature.
In brief, allele symbols are typically formed for endogenous genes (including mutant
and targeted alleles) according to GeneSymbolAlleleID where the AlleleID is:
- an abbreviated descriptive word or phrase for spontaneous or induced alleles
(induced alleles include a lab code).
Ex.
Faslpr for the spontaneous "lymphoproliferation" allele of the
Fas gene, or
Adam17m1Btlr for the chemically induced allele "mutation 1,
generated or first described by the laboratory of Bruce Beutler".
- of the format "tm" ("targeted mutation"), a serial number and a lab code for
targeted alleles (includes knock in, knock out, floxed/FRT, reporter, etc) generated via
homologous recombination.
Ex.
Mfge8tm1Shur for "targeted mutation 1, laboratory of
Barry D. Shur".
- of the format "em" ("endonuclease mediated"), a serial number an a lab code for
endonuclease mediated genome edited alleles. Endonuclease strategies may include
zinc finger nucleases, TALENs, or CRISPER/Cas systems.
Ex.
Tcf7l2em1Nobr for "endonuclease-mediated mutation 1, generated
by the laboratory of Marcelo A. Nobrega".
- of the format "Gt" ("gene trap"), serial number referencing the original cell line
and/or targeting event, laboratory code for gene trapped alleles.
Ex.
Vangl1Gt(XL802)Byg for the "gene trap generated by random
insertion in cell line XL802 by Bay Genomics".
or for transgenes, where a non-mouse sequence is introduced:
- Tg(promoter-gene)SerialNumberLabCode where "Tg" indicates "transgene", the
construct promoter used to drive expression is listed first, followed by the
gene expressed. Syntax for the promoter and gene are reflective of the species of
origin (commonly: sentence case for mouse, uppercase for human, all lower case
for bacterial).
Ex.
Tg(ACTA1-cre)1Mll for a transgenic allele constructed using the human
ACTA1 promoter to express bacteriophage-derived cre recombinase, insertion 1, generated
by the laboratory of Ulrich Muller.
To follow the example below, open the allele detail page for
Trp53tm1Brd.
|
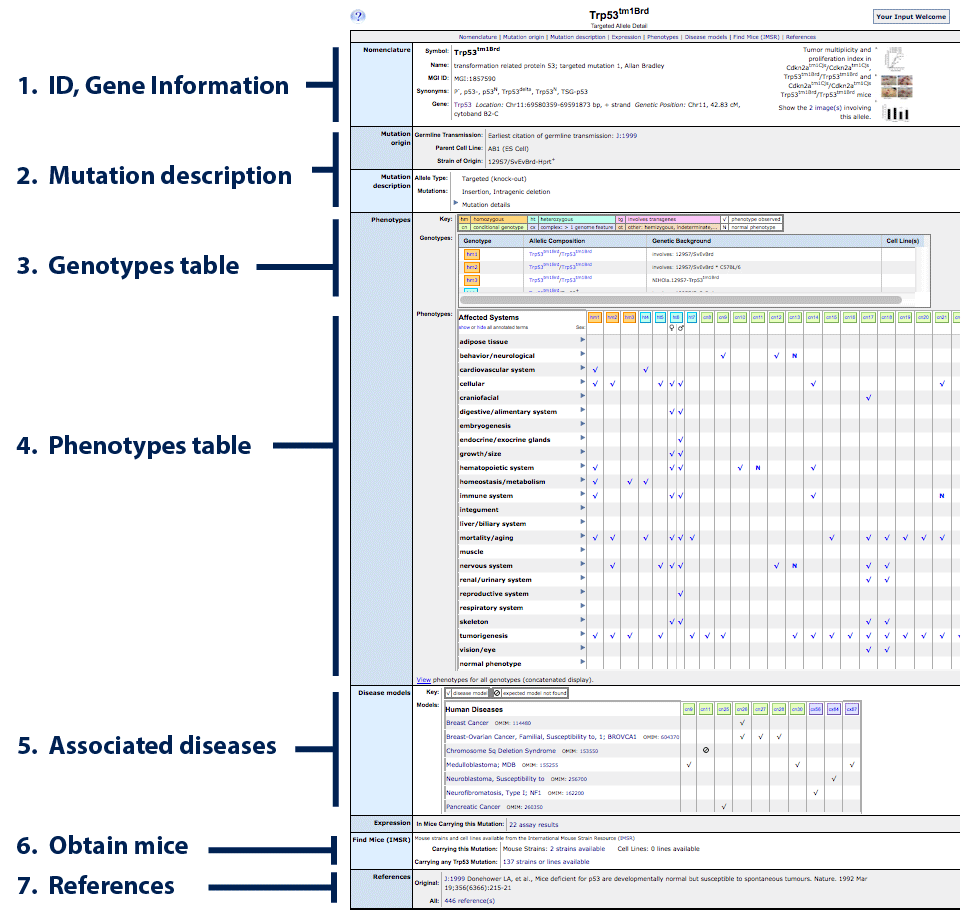
- IDs and gene information: official allele symbol,
synonyms and links to the gene detail page.
- Mutation description: allele type, links to the original
publication reporting generation of the allele (J:#) and
descriptive text. Click the triangle next to Mutation details
to reveal (yellow arrow).
- Genotypes table: lists all the genotypes
where a phenotype has been reported. Each row in the genotypes table
has a corresponding column in the phenotypes table.
- Phenotypes table: records all of the phenotypes
that have been reported for a given genotype of this allele according
to structured Mammalian Phenotype vocabulary. Match each column in this
table to a genotype row in the table above.
- Associated diseases: If any genotype of this specific allele
has been reported to be a model of human disease, this table will appear.
Check marks in columns indicate which genotype was used to report this
finding.
- Order Mice: links will appear here for
commercially available strains or targeted pluripotent ES cell lines.
Information on availability comes from the
International Mouse Strain Resource (IMSR) which searches all of
the major repositories and provides links to order forms.
- References: A list of all MGI-curated publications
that have reported using mice carrying this allele.
|
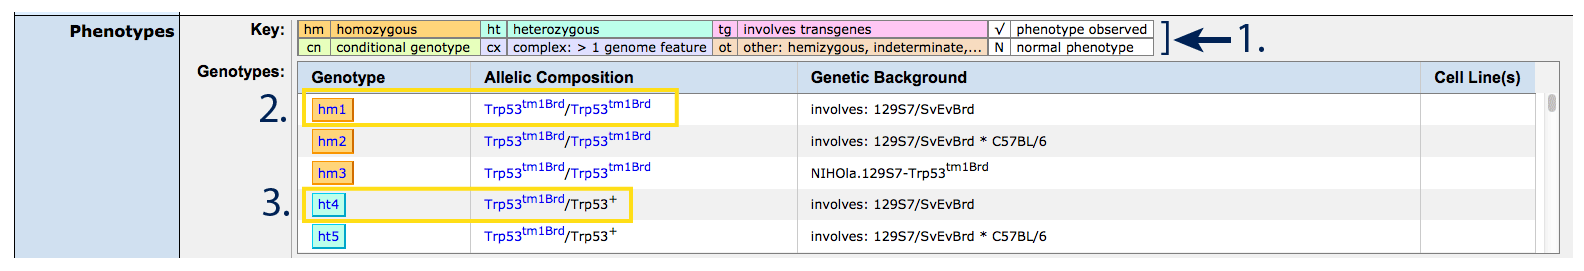
Genotypes Table
A color coded key representing allele state appears above the genotypes
table (#1) which reports allele composition,
genetic background and cell line. Genotypes are differentiated by allelic
composition (allele symbol, zygosity, additional alleles, recombinases or
transgenes if present) and genetic background, typically inbred or a
combination of inbred lines. If either the allelic composition or genetic
background varies, a new genotype ID (hm1, hm2, ...) and row will
appear. For guidelines and interpretation of strain nomenclature, see
here.
|
|
Each row in the genotypes table corresponds to a column in the Phenotypes table below.
- hm : homozygous : two copies of the same allele (see #2)
- ht : heterozygous : one copy of this allele, one copy of a different allele,
most commonly the endogenous functional or "wild type" allele (represented by "+", see
#3)
- tg : involves transgenes : carries a gene which has been
artificially introduced into the mouse via random integration (not
targeted into an endogenous locus), e.g. expression of a human gene.
- cn : conditional genotype : a genotype that is dependent (or
conditional) on the presence of some other factor, most commonly
cre-mediated excision of floxed sites. Both the floxed allele and the
transgenic allele will appear in the "Allelic Composition" column.
- cx : complex : involves more than one genome feature but does not
qualify as a conditional genotype, e.g. double knockouts.
- ot : other : included some sex-specific alleles (hemizygous), not
reported and genotypes that do not meet the previous categories.
[Return to Allele Detail]
[Return to Table of Contents]
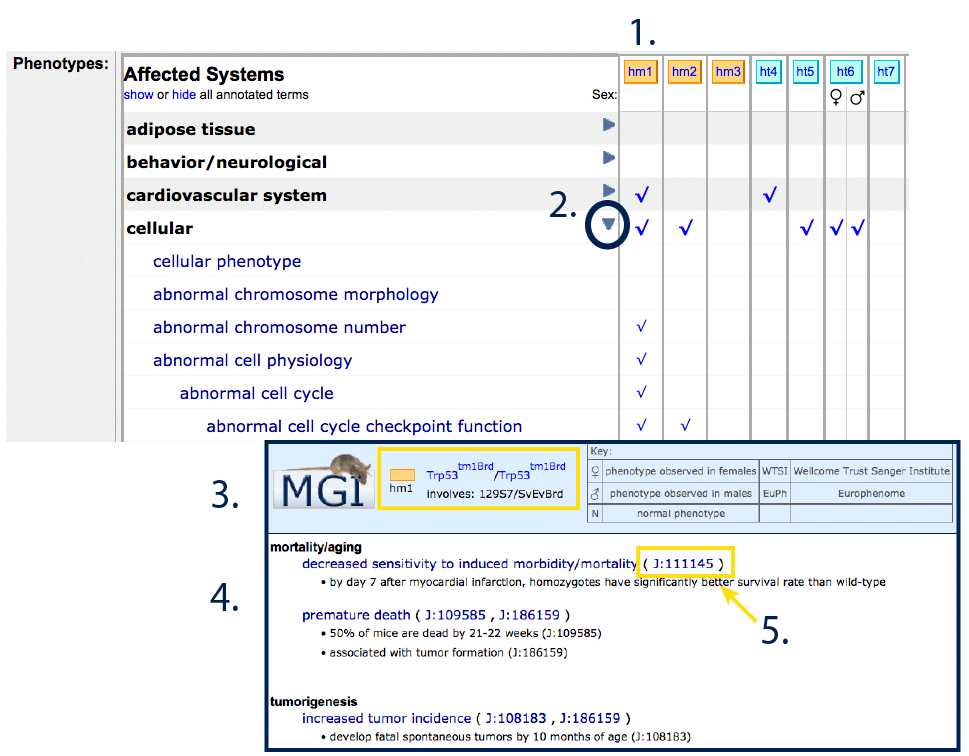
Phenotypes Table
|
Each column in the phenotypes table reflect the phenotypes and
observations associated with the matching row in the genotypes table
(#1).
Expand affected physiological
system terms by clicking the triangles within the row (
#2) to reveal more detailed structured vocabulary terms. If at
least one differential phenotype has been reported for males and
females, columns will be subdivided with icons just below the genotype
header. Clear spaces indicate that no phenotype was reported, and an
"N" will appear if the system was specifically examined and reported as
"Normal".
Clicking on check marks or column headers will generate a pop-up window
for that genotype (#3) with free text
descriptions (#4) and associated
references for those annotations (#5).
[Return to Allele Detail]
[Return to Table of Contents]
|
|
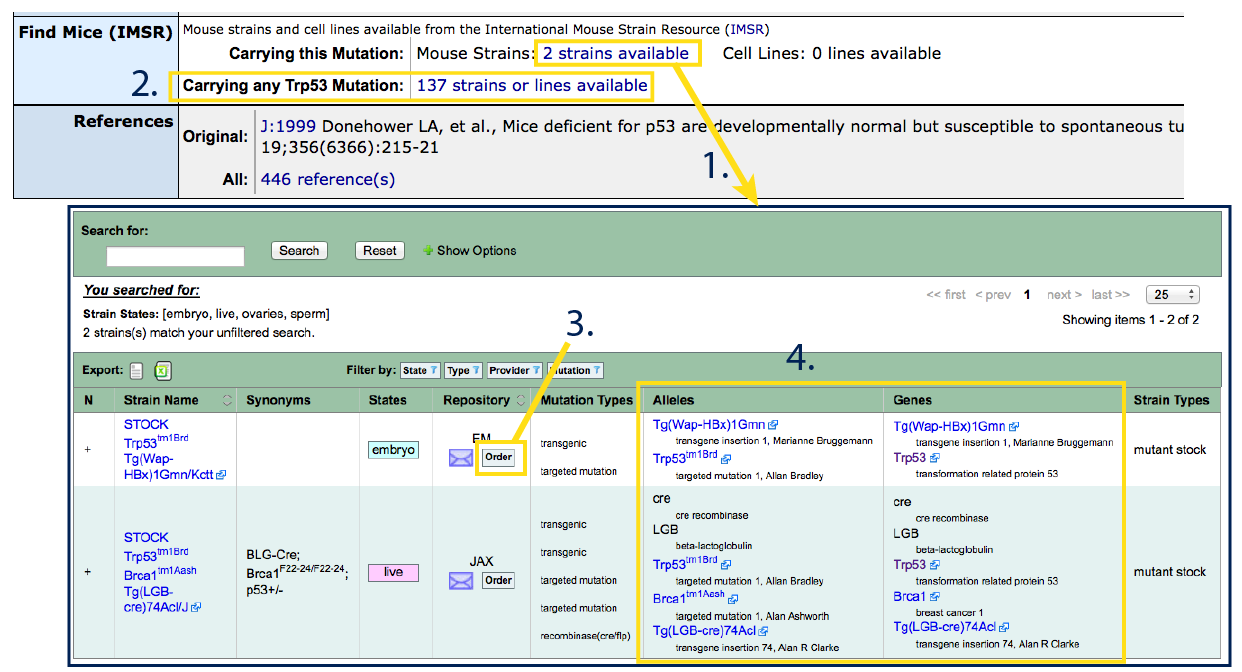
Order Mice
Links appear in the Find Mice (IMSR) row if a mouse strain or
pluripotent ES cells carrying the mutation are available for purchase through
any of the major international
repositories indexed by the
International Mouse Strain Resource (IMSR). If links do not appear, this
means that the strain has not been deposited for commercial distribution,
however it may still be possible to obtain mice by contacting the researcher
who developed the line initially. His or her information can be located in
the Nomenclature or Mutation Origin section (see J:# next to "Earliest
citation of germline transmission") at the top of the allele detail page,
or in the reference specified as "Original" at the bottom.
|
If a mouse or ES cell line is available carrying the exact allele from this
allele detail page, a hyperlinked number will appear next to "Carrying this
Mutation:" (#1). If other alleles of the
same gene exist and are commercially available, another hyperlinked number
will appear below, next to "Carrying any GeneSymbol Mutation:"
(#2).
Available strains will be indicated including the full genotype (see
Strain Name for inbred background), state (live/embryo/sperm/ES cell line),
repository (provider, #3) and allele
details (#4). Confirm in the "Genes" and
"Alleles" columns (#4) that the strain
carries only (or all of) the mutations that are desired.
Note: in the example
below, you can see that the first strain carries both Trp53tm1Brd
and a Tg(Wap-HBx)1Gmn transgene.
Once satisfied, you can find purchasing information (prices, timelines,
MTAs) and place an order by clicking on the Order button
(#3). For purchasing or strain specific
questions, you can also contact the repository directly by using the purple
envelope icon.
[Return to Allele Detail]
[Return to Table of Contents]
|
|
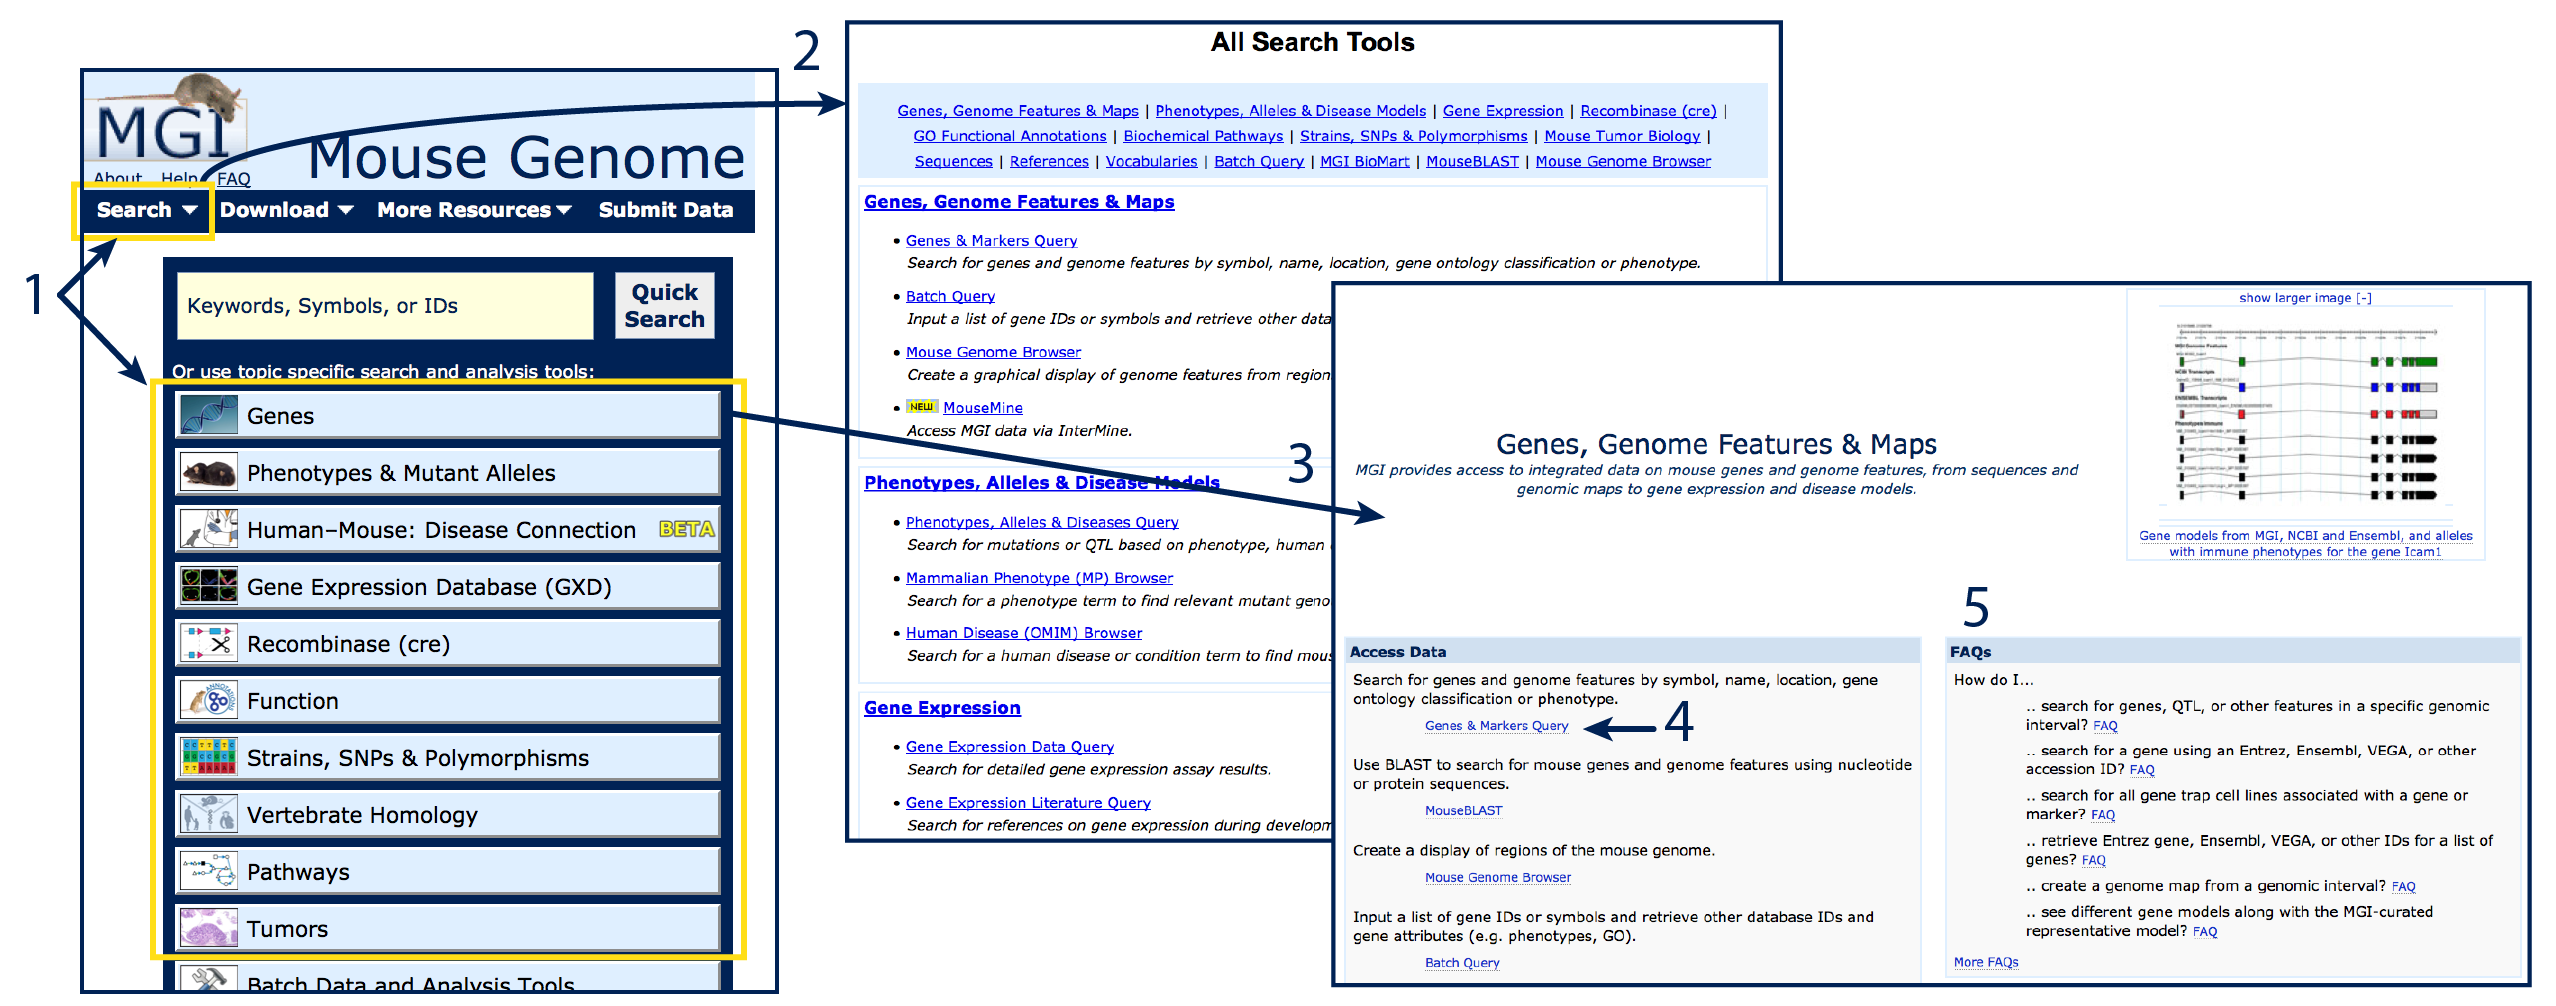
4. Query forms
Query forms allow researchers to set parameters and retrieve gene (or other) lists that
match a term or terms of interest. Query forms are organized by topic, and can be accessed
either from the Search dropdown menu in the dark blue bar at the top of the page,
or by selecting a topic from the list below the Quick Search on MGI's home page
(#1). Clicking on Search will open a list with All Search
Tools (#2) where you can see names and brief descriptions
of the search tools available. Click on the hyperlinked query forms to open. Clicking on
topic buttons will open a minihome landing page corresponding to that topic (#3).
Minihome landing pages list relevant query forms (#4)
as well as FAQ guides for common queries (#5).

Each query form allows you to specify what you are searching for, place constraints or
parameters in order to tailor your search more effectively and choose options for results
output. Each field in the query form is optional; leave fields blank to default to "all".
Use the FAQ
to walk through several examples of searches using query forms and to help choose the
best form to answer your biological question. The FAQ index can also be accessed by following
the link beneath the MGI logo in the header of all MGI web pages.
On each query form, clicking the question mark icon in the top left of the page
will generate a pop-up window with form-specific user documentation.
Example query: how to find a list of genes annotated
to a particular phenotype or function
|
To retrieve a list of genes or markers satisfying your query, use the
Genes and Markers query form,
found on the dropdown menu via Search > Genes > Genes and Markers or
from the Genes
home page.
To retrieve a list of alleles satisfying your query, use the Phenotypes, Alleles & Disease Models Search,
found on the dropdown menu via Search > Phenotypes > Phenotypes, Alleles and Diseases Query or
from the Phenotypes & Mutant Alleles
home page.
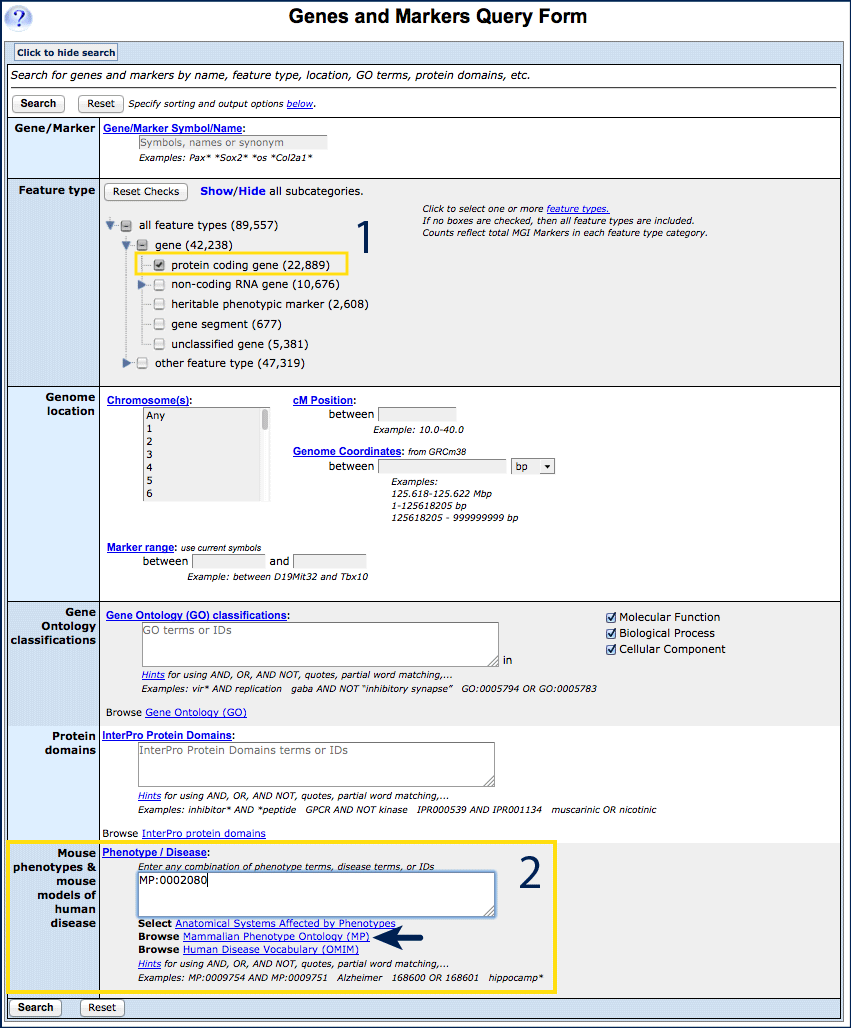
This example will use the Genes and Markers query to search for all
protein–coding genes where a mutant allele has been involved in a
genotype annotated to embryonic lethality.
- Open the Genes and Markers query form.
- Select protein coding gene from the Feature Type options (#1).
- For optimal specificity, Enter the structured vocabulary term MP:0002080
(corresponding to "prenatal lethality") into the Phenotype/Disease window
(#2).
Text–matching, keyword and Boolean searches will also work, search the
Mammalian Phenotype Browser
for structured vocabulary terms.
- Click Search to retrieve a results table. Export, sort and save if desired.
[Return to Query]
[Return to Table of Contents]
|
|
Example query: how to retrieve MGI IDs (or other IDs)
for a list of genes
|
Use the Batch Query,
found on the dropdown menu via Search > Batch Query or
from the Batch
Data and Analysis Tools link from the homepage to add IDs, attributes or
other information to a list of genes or probes.
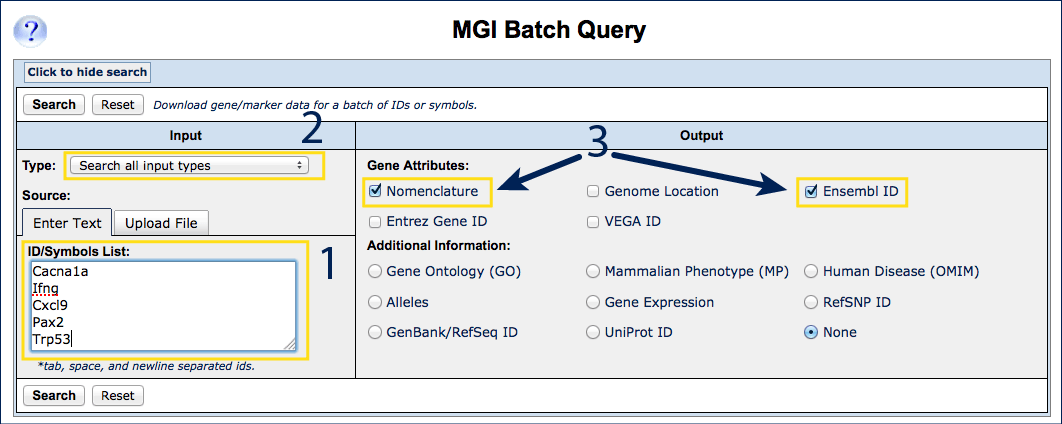
This example will use the Batch Query to add MGI and Ensembl IDs to the
genes Cacna1a, Ifng, Cxcl9, Pax2 and Trp53.
- Open the Batch Query form.
- Write or paste Cacna1a, Ifng, Cxcl9, Pax2, Trp53 into the
ID/Symbols list in the Input section of the page (#1).
Entries are case independent.
- Choose "Current Symbols Only" from the "Type:" drop down
menu above the input window, or leave at the default "Search All Input
Types" (#2).
- Select Nomenclature (Gene Name and MGI ID) and Ensembl ID
from the Gene Attribute options on the right, along with any
Additional Information (#3).
- Click Search to generate a results list.
[Return to Query]
[Return to Table of Contents]
|
|
Example query: how to find gene expression data in
a specific tissue, at given developmental stage
|
Use the Gene
Expression Data Query, found on the on the dropdown menu via Search >
Expression > Gene Expression Data Query or
from the Gene
Expression Database (GXD) homepage, to access integrated gene expression
data and images provided by GXD.
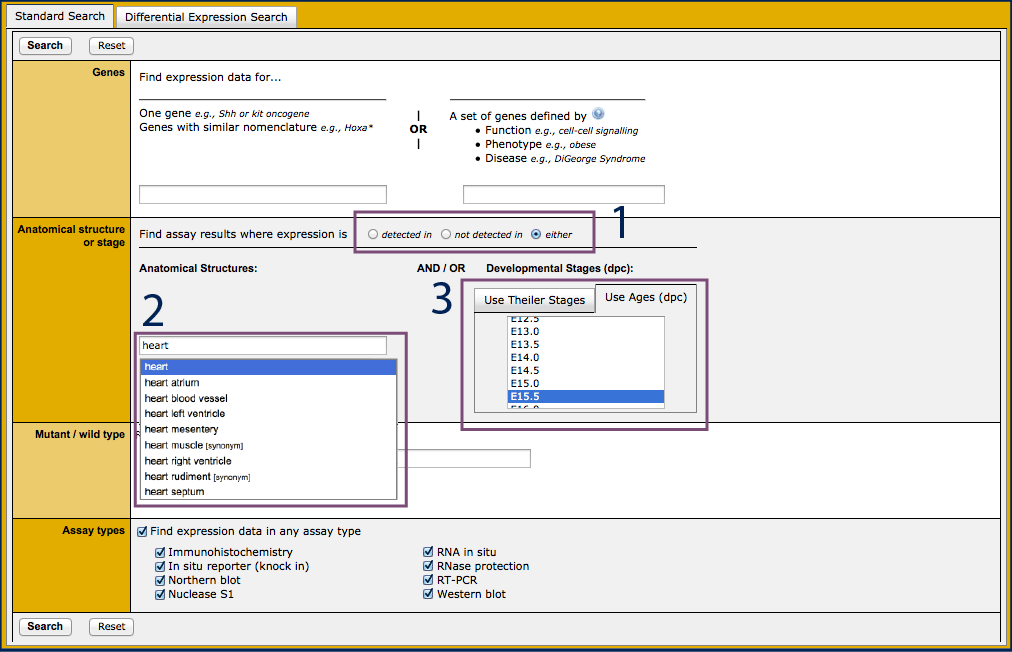
This example will use the Expression Data Query to retrieve a list of genes
assays and images with annotations to the embryonic heart at E15.5.
- Open the Gene Expression Data Query.
- Select whether to return assay results where expression was reported
as detected in, not detected in, or either
(#1). The default is to return "either".
- Begin typing the word "heart" into the Anatomical Structures
field, and select it from the list of autocomplete options when it
appears (#2).
- Change tabs in the Developmental Stages options to Use
Ages (dpc) and choose E15.5(#3).
Developmental Stage can also be specified using
Theiler Stages (TS)
which are based on expected anatomical feature development and
allow cross–species comparisons.
- Click Search to retrieve data and sort, filter or navigate tabs
in results.
See more about Expression in the Gene Detail:Expression section here.
[Return to Query]
[Return to Table of Contents]
|
|
Starting from a Reference
|
Many users come to MGI looking for more information about a particular mouse
allele or strain that they encountered while reading through scientific literature.
If multiple alleles of a gene exist, it may not be immediately clear which
allele corresponds to the one from that publication, especially if the authors
did not use standard allele nomenclature for the allele symbol.
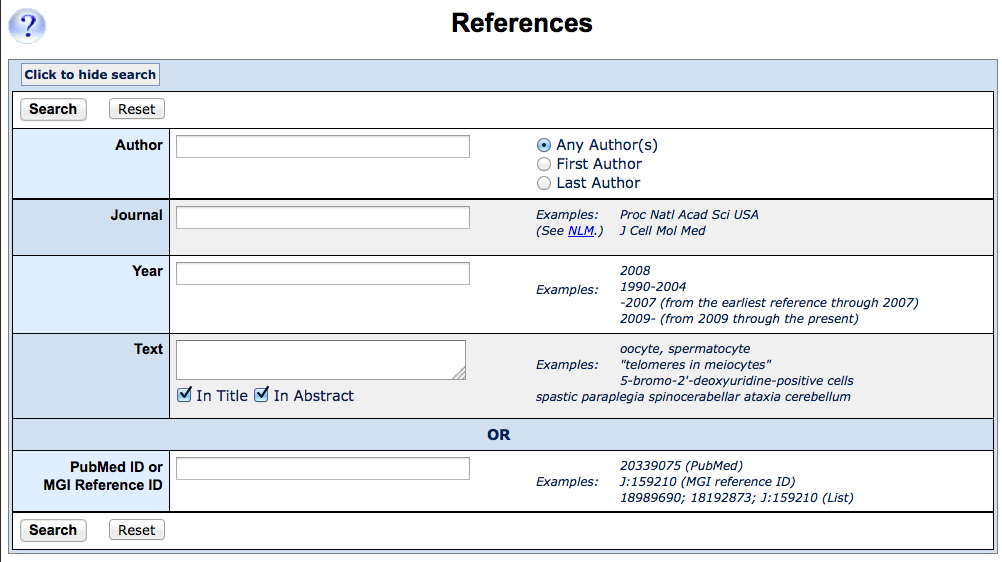
You can search MGI by author, citation or publication keywords
using the
Reference Query Form. This can be accessed from the Search dropdown menu
under References, see #1 in
4. Query Forms to locate.
Enter some element or elements and click Search to continue. |
|
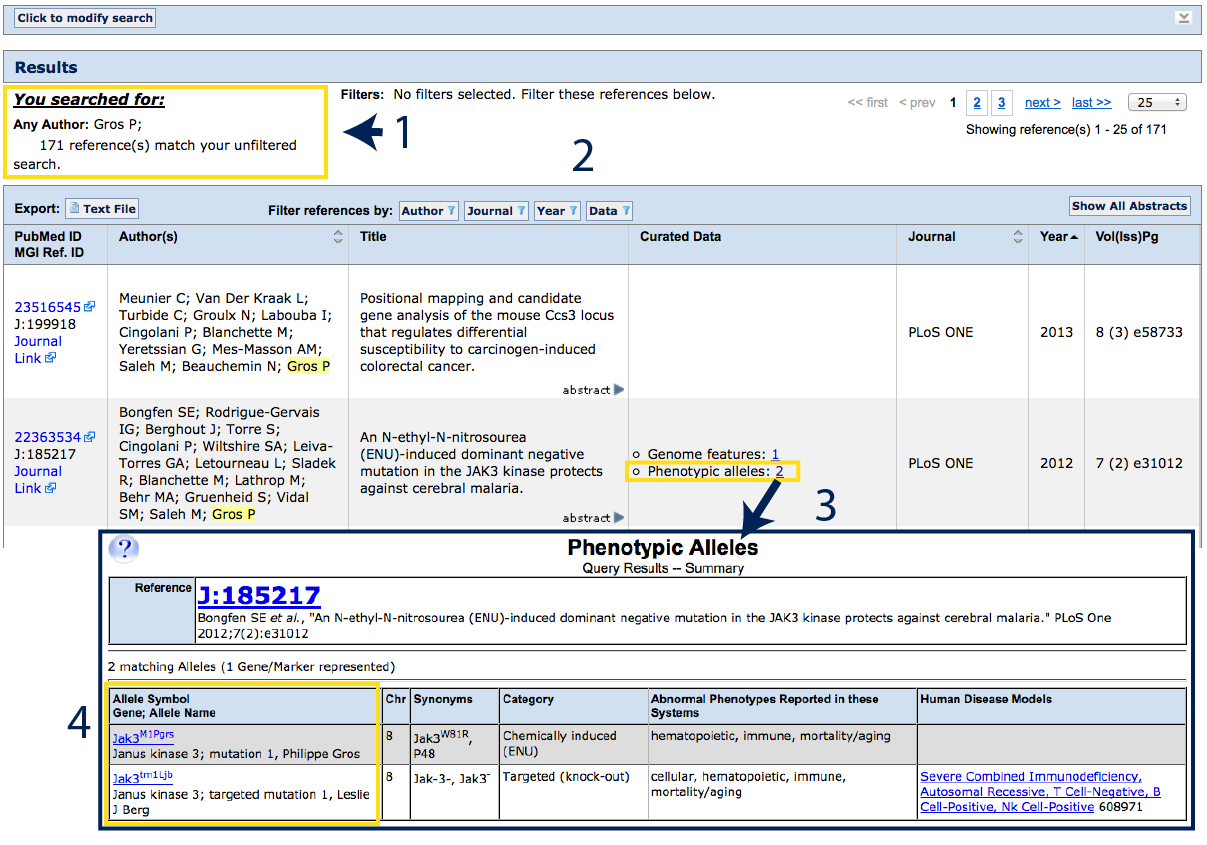
| The search will match according to your input; in this case an Any
Author search for Gros, P. See above the results table (#1)
to see what was entered. You can modify your search from this page or add filters
to narrow your list of results if desired.
The results table (#2) will return the complete
citation for all references matching your search that have been curated by MGI.
If a paper has curated data (phenotypic alleles, sequences, expression records,
functional annotations, mapping data, etc), these will be indicated in the central
Curated Data column. For mouse mutants, click on phenotypic alleles
(#3). A summary will appear with the details of
the data (#4). In the example to the right,
two different alleles of Jak3 were studied. Click on the Allele Symbol to
go to the Allele Detail Page.
[Return to Query]
[Return to Table of Contents]
|
 |
5. Batch Data
For more customization, or to work with large–scale data, MGI provides bulk reports
available for download in tab delimited format, or several computational access options allowing
users to generate their own reports and analyses. MGI reports are refreshed weekly and
posted to an ftp site, see below.
Accessing batch data files
|
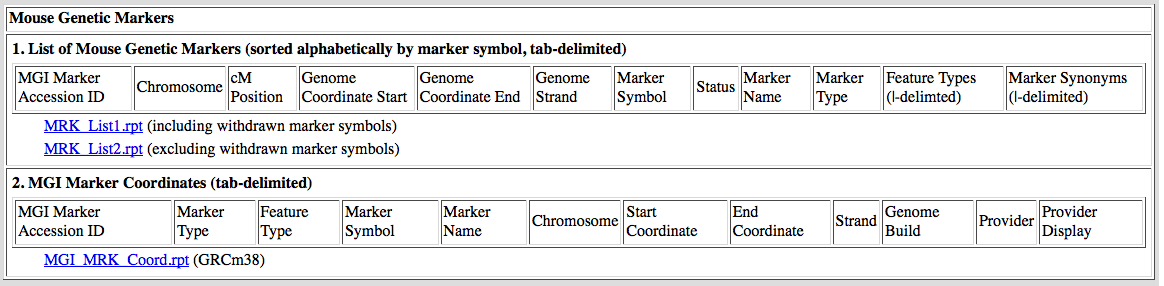
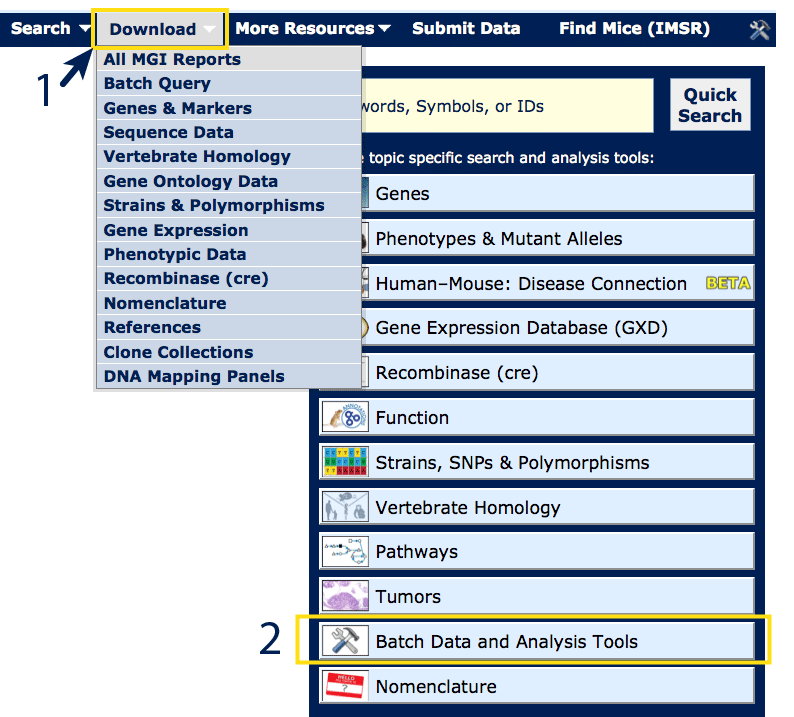
Over 75 batch files can located via the Download menu (#1), or from the
Batch Data and Analysis Tools link on the homepage (#2).
Data are tab delimited (or pipe-delimited where indicated) with header rows.
Each field represented in the data is described briefly in the header row
on the index page. An example appears below.
Where coordinates are displayed, the genome build will also be indicated on
the index page. For current coordinates, MGI uses GRCm38 with feature annotation
from VEGA.
Files are in .rpt format, which can be opened by Mac or PC as plain text, readable
by most browsers, text editors, Excel or other applications. If you do have
difficulty opening these files, please contact User Support.
Example file:

[Return to Batch Data]
[Return to Table of Contents]
|
|
MouseMine computational access
|
MouseMine is a new computational access platform for MGI data that offers maximal flexibility,
with numerous predefined templates, customizable queries, list enrichment tools
and other list or analysis options. Results from MouseMine can be saved online,
downloaded or forwarded to Galaxy.
MouseMine can be accessed from the Search drop down menu via Search >
MouseMine, from the Batch
Data and Analysis Tools link on the homepage, or by direct url at
http://www.mousemine.org/mousemine/begin.do
MouseMine has it's own documentation, see the Help and FAQ in the
top right of the page (#4), or use the
links in the First time here? box.
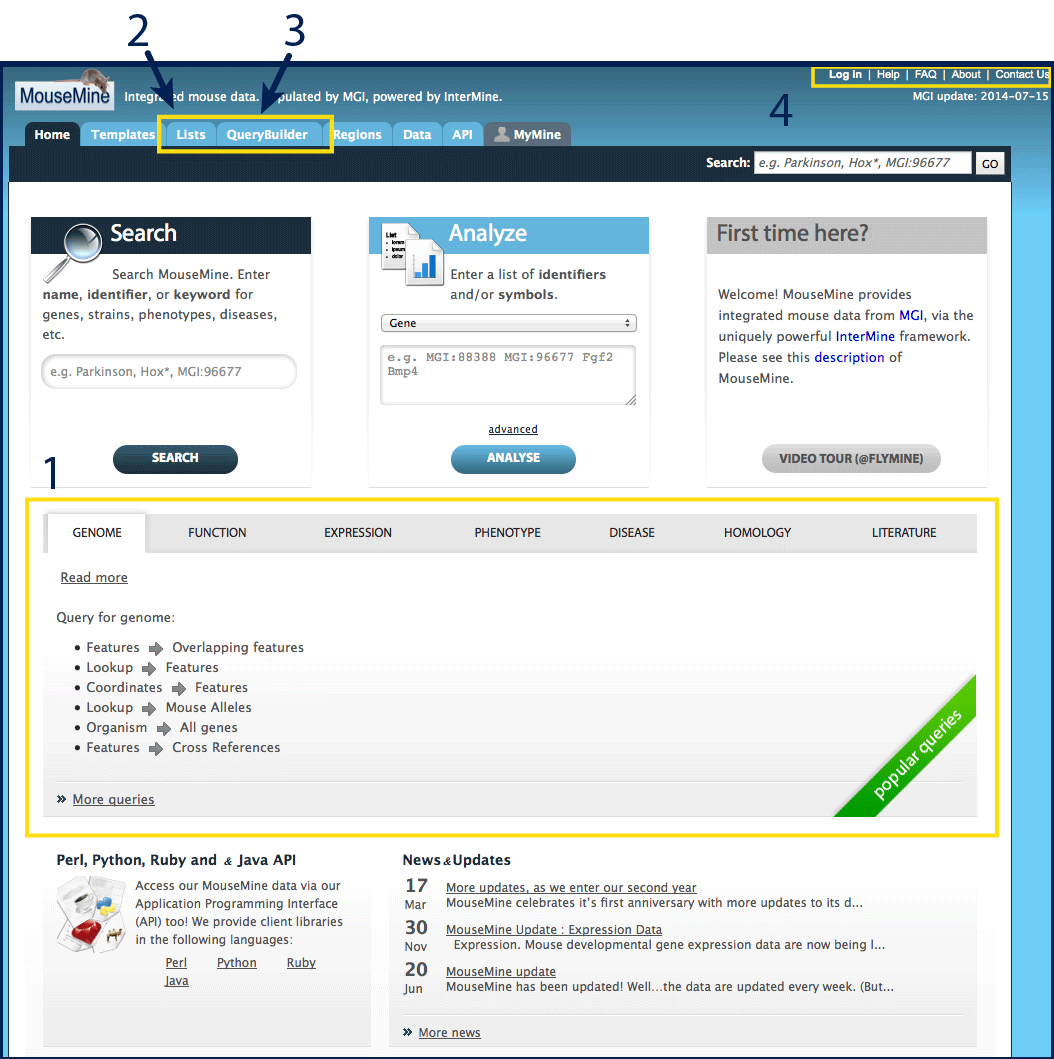
Basic Features:
For common questions, templates have been generated which can be browsed
from the MouseMine home page (#1) or the
Templates tab at the top of the page.
To upload a list, view a saved list, perform list enrichment analysis, or
run queries from a list, use the Lists tab (#2).
For computationally savvy users, build custom queries through the Query Builder
tab (#3). Please use the link to browse the
data model to ensure that your query will search against the expected data
structures. Additional documentation can also be found through InterMine.
Create an account to save lists and queries (#4),
or contact MouseMine developers with questions.

[Return to Batch Data]
[Return to Table of Contents]
|
This site uses cookies.
Some cookies are essential for site operations and others help us analyze use and utility of our web site.
Please refer to our
privacy policy
for more information.
 Analysis Tools