New features for GXD
- Gene cart added to the Tissue x Gene Matrix. A gene cart has been added to the Tissue x Gene Matrix tab of the expression search results. Previously, users could only filter by genes shown on the matrix page they were viewing. Now, with the new gene cart, they can page through the results, selecting genes for filtering from multiple pages.
- Filter expression results by sex. Users can now filter expression search results to include only data derived from specimens for which the authors specified the sex. In addition, a column displaying the sex of the specimen has been added to the Assay Results tab of the expression search results.
- Expanded batch search options. Gene list searches performed using the GXD Batch Search can now be limited to current mouse symbols and synonyms. Previously, symbol and synonym searches included those of homologs as well. This new input option has also been added to the MGI Batch Query.
- Antibody summaries are now available in the Molecular Reagents section of gene detail pages and in the Curated Data section of reference detail pages. These summaries include the number of publications that have used each antibody, making it easier to identify commonly used ones.
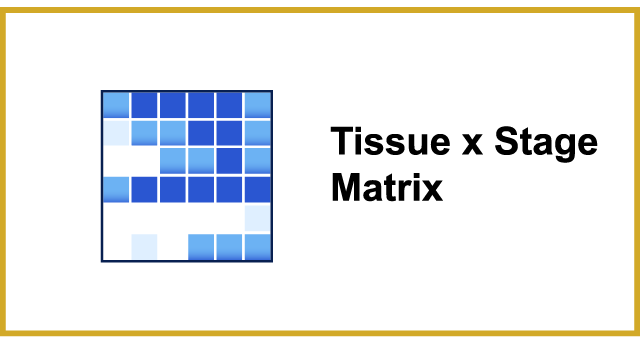
- Additional colors have been added to the Tissue x Stage and Tissue x Gene matrices in the GXD query results summary, making it easier for users to distinguish the number of annotations represented in each cell.
- Enhanced interactivity between GXD and Morpheus. Results from GXD RNA-seq data searches can be forwarded to Morpheus, the Broad Institute's heat map visualization and analysis tool. Now, after performing analyses in Morpheus, users can select genes of interest and retrieve GXD's multi-tabbed expression summaries for these genes, which include both classical and RNA-seq results. Additional types of information for these genes can be accessed by using buttons on the Genes tab to forward the gene list to either the MGI Batch Query or MouseMine. MouseMine also offers tools for enrichment analysis.
Enhanced ability to search for RNA-Seq and microarray experiments by postnatal age
The GXD RNA-Seq and Microarray Experiment index allows users to find experiments of interest based on GXD's standardized metadata annotations. GXD curators annotate sample details, including age, which can be queried using the RNA-Seq and Microarray Experiment Search. We have expanded the age search functionality for all samples, but it is especially useful for postnatal searches. Previously users were limited to three search options: embryonic (all ages), postnatal (all ages), or selecting specific embryonic ages from a picklist. Now users can enter the ages of interest for both embryonic and postnatal samples. They can enter a single age, a range of ages (using a hyphen), or a list of ages (using commas) to find the experiments of interest.
New ways to access RNA-Seq and microarray experiment index entries
Previously, entries in the GXD RNA-Seq and Microarray Experiment index were only accessible via the RNA-Seq and Microarray Experiment Search. We have introduced additional access points to make it easier to find experiments of interest. Links in the Developmental Anatomy and Cell Ontology browsers return summaries of all experiments with samples annotated to the selected anatomical structure or cell type (or any of its subterms). Index entries are now included as a curated data class associated with a reference. This allows us to provide links on the reference detail pages that summarize the RNA-Seq or microarray assays reported in that publication. Additionally, users can now search for papers using the Reference Search and apply the curated data class filter to limit the return to publications that use RNA-Seq or microarray assays.
New Cell Ontology Browser and Filtering by Cell Type
The Cell Ontology Browser can be used to find and view descriptions of cell types from the Cell Ontology (CL), and to retrieve GXD expression data associated with specific cell types. Additionally, we have developed a set of high-level cell type terms that can be used to filter search results from GXD expression queries and Quick Search results.
- Ontology for Cell Types. The Cell Ontology (CL) is a hierarchically-structured controlled vocabulary that describes a broad range of canonical biological cell types. The CL is not organism-specific, covering cell types from prokaryotes to mammals, but excludes plant cell types. The CL is an OBO Foundry ontology and is available at: https://obofoundry.org/ontology/cl.html.
- GXD expression data annotated to cell types. GXD uses terms from the Cell Ontology to annotate mouse expression data to specific cell types. This has enabled GXD to refine the representation of gene expression patterns, and will allow for the integration of single-cell transcriptomics data.
- Using the Cell Ontology Browser. You can either search or browse for cell type terms from the Cell Ontology Browser entry page. The page for a selected cell type term displays details for that term, including its unique accession ID, definition and parent terms, as well a Tree View in which the highlighted term is presented in the context of a classification hierarchy. The Tree View also displays the number of expression results for a cell type, a link which retrieves all GXD results annotated to that cell type, and provides access to expression images and assay details.
- Filtering by Cell Type. High-level cell type terms from the Cell Ontology can now be used to filter GXD expression data queries. This feature is also available for the Genome Features and Vocabulary Terms tabs of the Quick Search. In each case, the Cell Type filter limits results to those with GXD expression data annotated to cell type terms (and subterms) matching the high-level filtering term.
RNA-seq experiment type querying now available in the RNA-Seq and Microarray Experiment Search
The RNA-Seq and Microarray Experiment Search uses GXD's standardized metadata annotations to allow users to quickly and reliably find studies of interest that examine expression in adult and embryonic mice. Bulk, single-cell, and spatial RNA-Seq data provide different types of expression information. Although these differences are of interest to users, they cannot be searched at GEO, the major public functional genomics data repository, and data sets in GEO can include a mix of these methods. Therefore, GXD curators have annotated all RNA-seq samples in its RNA-Seq and Microarray Experiment index to one of these three methods (bulk, single-cell, and spatial). This allows users to specify the method of interest in the initial search or, alternatively, use the Method filter found on the search summary to refine the return. Currently there are ~7,000 RNA-seq experiments, 160,000 RNA-Seq samples, and 5,300 mutant alleles included in the search index.
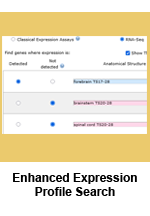
Expression Profile Search redesigned and enhanced
The GXD Expression Profile Search is a tool to search for genes by their expression profile. We have redesigned and enhanced this utility to make it more versatile, improve its search speed, and include access to RNA-seq data.
More versatile searches: Users have always been able to define the expression profile of interest by specifying up to 10 anatomical structures and whether expression is present or absent in these structures. Now users can also specify the developmental (Theiler) stage(s) of interest. They can define search profiles based on developmental stages alone or they can use combinations of anatomical structures and developmental stages. The addition of this functionality to the profile search allowed us to retire the Differential Expression search as all its utilities (and more) are now available in the redesigned Expression Profile search.
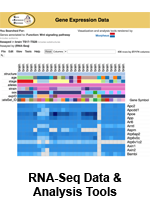
Inclusion of RNA-seq data: Previously the Expression Profile Search was limited to classical expression data. The indices and code powering profile searches have been redesigned, resulting in significantly improved search speeds.
This allowed us to expand the profile search to interrogate RNA-seq data.
Two different search modes: Due to the different nature of the data, the profile search has a Classical Expression Assays mode and an RNA-Seq mode. For instance, due to the need to undertake serial sectioning of the anatomical structure to confirm the absence of expression in it, when describing the results from in situ experiments, authors tend to underreport the absence of gene expression.
Thus, in Classical Expression Assays mode the "not detected" search returns genes recorded as not detected, as well as genes for which expression in the specified anatomical structures and / or developmental stages is not recorded in the database (not analyzed).
In contrast, absence of expression information is complete for the anatomical structures studied using RNA-seq. Accordingly, the "not detected" search in RNA-Seq mode only returns genes for which gene expression was reported to be absent (below cutoff).
New autocomplete functionality: The anatomical structure field has always been supported by an autocomplete function to help users find terms included in our anatomy ontology. Now, as a further aid, the autocomplete is limited to anatomical structures and stages for which GXD has expression data, ensuring users will choose terms that will result in fruitful searches.
Improved Matrix Displays: The Matrix displays in the search summary (Tissue x Gene for classical data searches, Tissue x Stage for both search modes) now display each profile structure on its own row, making it easier to interpret returned results.
More visible access to Morpheus heat map visualization and analysis tools: Expression results obtained from RNA-seq searches can be forwarded Morpheus, a tool created at the Broad Institute, for display and analysis, including sorting, filtering, hierarchical clustering, nearest neighbor analysis, and visual enrichment.
Although we have long supported exports to Morpheus, this functionality has been made more prominent by adding a tab, entitled "Heat Map," to search summaries.
The Global Biodata Coalition (GBC) designated GXD a Global Core Biodata Resource

Global Core Biodata Resources are biodata resources that are of fundamental importance to the wider biological and life sciences community and the long term preservation of biological data. They:
- provide free and open access to their data,
- are used extensively both in terms of the number and distribution of their users,
- are mature and comprehensive,
- are considered authoritative in their field,
- are of high scientific quality, and
- provide a professional standard of service delivery.
Their operation is based on well-established life-cycle management processes and well-understood dependencies with related data resources. GCBRs have either terms of use or specific licenses that conform to the Open Definition, to enable the reuse of data.
|
 Analysis Tools