The goal of the Human–Mouse: Disease Connection (HMDC) is to provide seamless human-to-mouse
data traversal, enabling clinical and translational researchers to take advantage of the wealth
of data and annotations from mouse models; as well as allowing mouse researchers to connect
their findings directly to genetic associations reported in human disease.
The mouse is genetically and physiologically similar to humans, is tractable as a
laboratory animal, has a fully sequenced and well-annotated genome, and a readily available
set of powerful molecular technologies for manipulating its genome in very precise ways.
Now, clinical researchers whose primary focus is on human genetic disease, variants, and
natural mutations have a highly-accessible way to explore experimentally characterized mouse
mutants for a spectrum of associated phenotypes, as well as known disease models developed
by the greater research community. Investigators can begin with genes (symbols, names or IDs)
or gene lists, genome positions (as coordinates from human or mouse, or as .vcf
files), OMIM diseases
or phenotypes, and retrieve a list of genes, annotated mammalian phenotypes, associated human
diseases and/or available mouse models for further research, along with comprehensive
supporting references. If you are new to working with mouse models, or encounter terms
which are unfamiliar to you, we also encourage you to browse the
Introduction to Mouse Genetics in order to aid with the interpretation of your results.
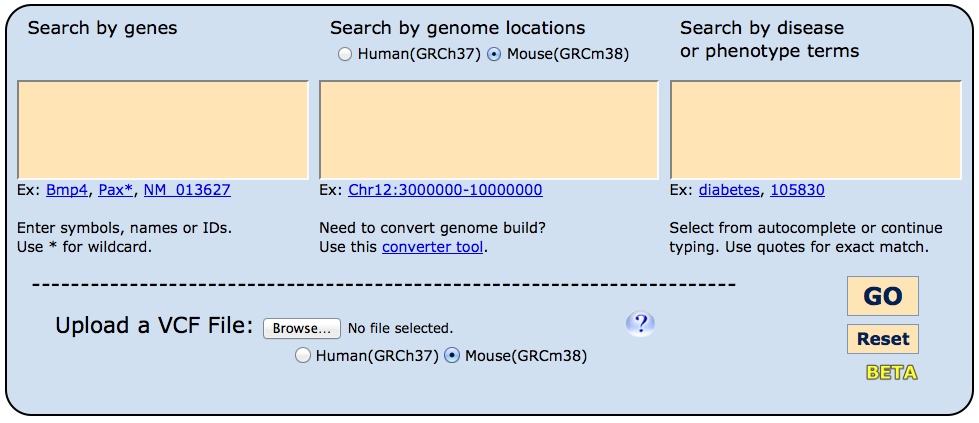
Beginning your search
Entry into the HMDC is designed to be straightforward. On the homepage, three boxes appear
where investigators may choose to enter (1) genes - either individually or multiples, (2)
a genome location or set of genomic regions, and/or (3) disease name(s) or mammalian phenotype(s).
- Searching genes:
Gene based queries will match official symbols, full gene names and synonyms in both human and
mice. An asterisk (*) can be used as a wildcard in the prefix or suffix.
Separate multiple entries using commas, spaces or new lines.
- Searching genome locations:
To search positions, please ensure that you are using the current genome
assembly (build) and have selecting the appropriate species using the radio
buttons above the search window. If you need to convert your data, a
simple online
remapping tool has been provided by NCBI. Currently
only base pair (bp) positions are supported, not megabase (Mb) or
linkage positions (i.e. centimorgans or band position). Separate multiple entries
using spaces, commas or new lines; please do not use commas within coordinate
positions as these will be misinterpreted as item separators for independent
genome locations.
- Searching disease and phenotype terms:
Disease and phenotype terms may be searched using text-matching by simply
typing in the box, or you can take advantage of structured vocabulary by
selecting from the autocomplete list that appears. Multiple entries are
supported, results must match at least one term, but are not required to match
all terms. Use the filters once the grid has been generated to restrict your list.
The shaded grey text to the right of autocomplete terms indicates the vocabulary
that an annotation applies to:
- Mammalian Phenotype: will match all
genes where a mouse model has been reported to exhibit this phenotype.
These are hierarchical, so selecting a broad general term will also
bring back genes annotated to more specific child terms. See the
Mammalian Phenotype (MP) browser.
- OMIM: from the
Online Mendelian Inheritance in Man database. Contains human diseases
with associated human genes and is cross-referenced externally and within
MGI for mouse genetic models of these human diseases.
- Some terms are very specific and may reference only a
subtype of the disease (ex. "Alzheimer disease, familial,
5"). In these cases, it may be preferable to use the
text-based matching without selecting an autocomplete value.
- Upload a vcf:
Variant call format (.vcf) file upload is also supported for phenotype and
disease annotation. This tool is not equipped to do functional analysis of
variants or filtering, so we recommend uploading a trimmed candidate list.
See
Exomiser for a filtering tool designed to process human data. The default is to discard all SNPs with a
known dbSNP identifier (rs#). If you want to keep these genes in your results
clear the contents of the sixth column, but do not delete it, so as to preserve
standard column structure. See Section on vcf files for more
information.
For many experimental questions, a single search box will be sufficient, but if two boxes
have search terms entered, the results will reflect cases matching on both categories (boolean
AND). While this can be an efficient shortcut, if a very precise phenotype or disease annotation
is used, some potentially relevant results may be omitted.
Whichever search box is used, the same set of results tables will appear. To follow along
with this example, enter “trp53 proc apc cdkn2a” into the Genes search box (not
case sensitive).
[return to top]
Search Results
Along the top, an orange banner remembers your original query and allows you to quickly
modify your results by adding, removing or replacing search terms. A second banner below
serves as a header for your results, and indicates which type of matching was run. The results
themselves are arranged into three tabbed tables for: Gene homology x Phenotypes/Diseases
(shown), Genes, and Diseases.
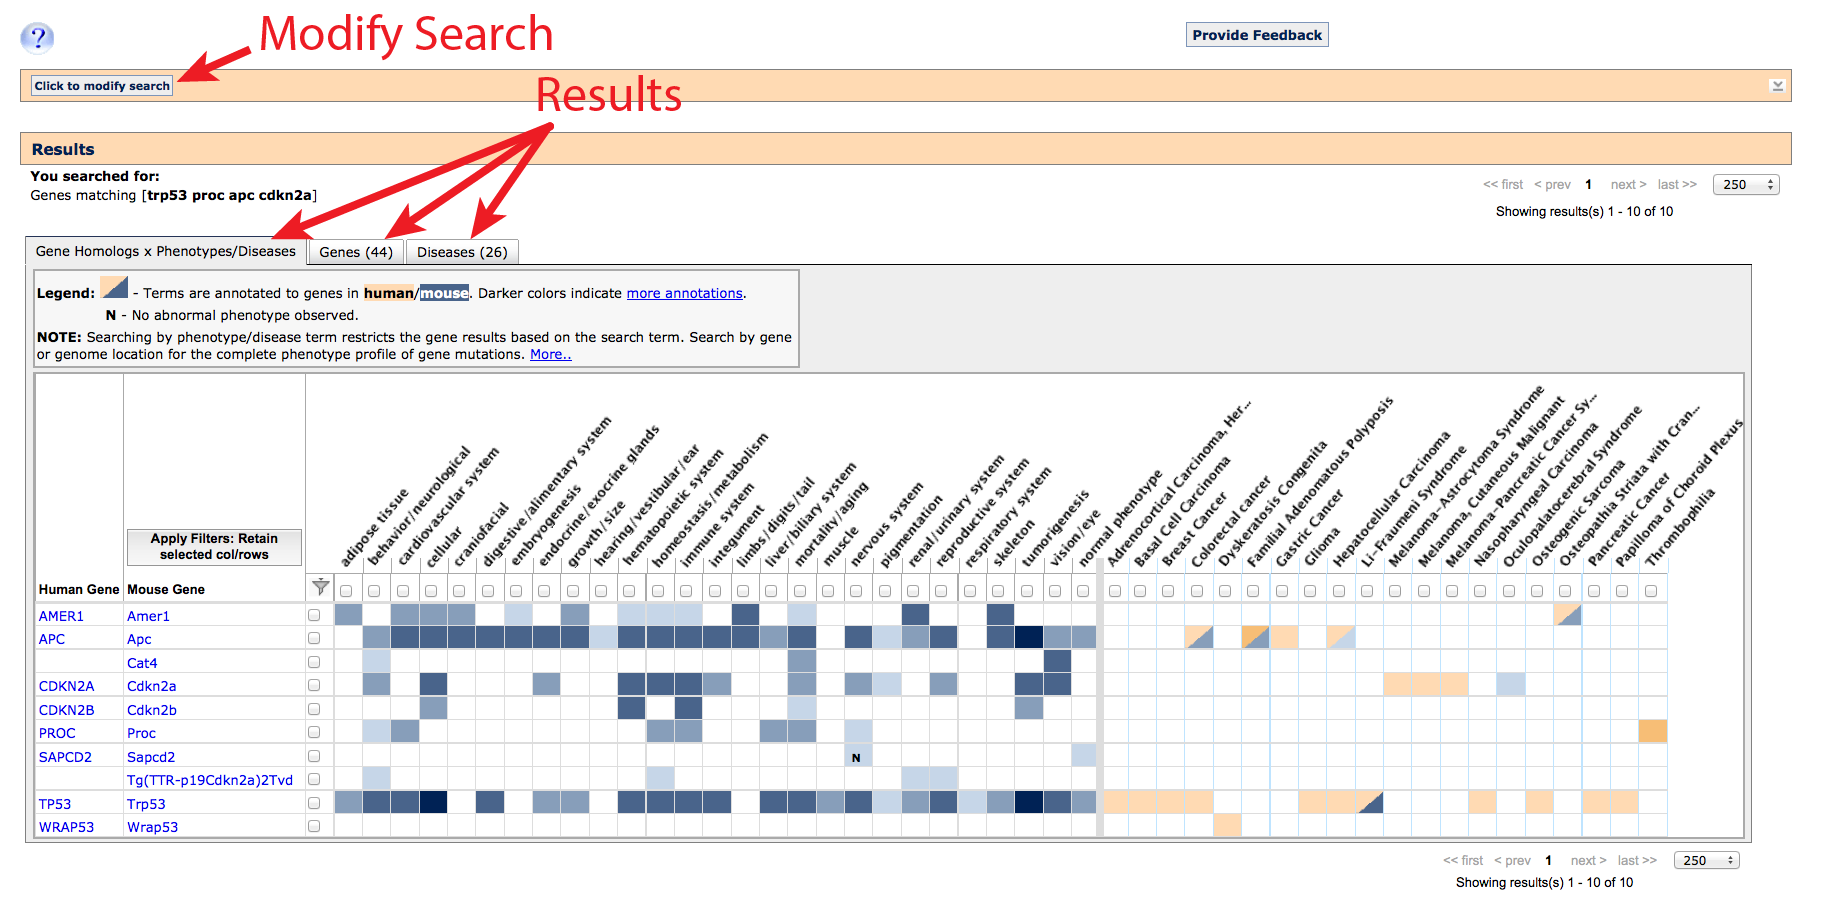
1. Gene homology x Phenotypes/Diseases tab
On this tab, a list of gene homologs (column 1: human, column 2: mouse)
and gene-associated phenotype (left side) or disease (right side) terms which matched
your search are returned as an interactive grid. Gene rows are only returned where
at least one phenotype or disease term has been annotated, and columns are only
displayed if at least one gene association has been reported. Matching
transgenes (denoted by "Tg(promoter-gene)lab_code"), where an artificial
construct has been introduced and expressed in a live mouse will also appear, but only
in the mouse column. This table compresses multiple alleles of a gene (if they exist)
into a single row.
- Filtering: Results can be filtered by clicking the boxes that appear
adjacent to each row and above each column. This will filter
all tabs.
- Click to place a checkmark in the rows and/or columns you would like
to keep and click on the "Apply Filters" button or filter icon in the
top left of the grid. If a physiological system, disease or gene symbol
match is not relevant to your experimental question, leave them unselected to hide.

- Filters can be removed by clicking on the "Remove filters"
note which will appear above all tabs, just below the orange Results header
bar.

- Left side of grid: If a mutant allele of a gene has been reported
to affect a particular anatomical/physiological system, a systems level phenotype
column will appear with a blue filled cell at the intersection of the gene and
phenotype. These use a hierarchical structured
vocabulary, navigate the
Mammalian phenotype browser to find specific terms or click on the filled box
to see more details.
- Darker shades of blue indicate more annotations to aberrant phenotypes
within this anatomical/physiological system
- Clear cells indicate no data.
- If an aspect of a system has been specifically examined in the
context of mouse gene mutants and found to be normal, an N
will appear (with blue background fill).
- If researchers determined that the mouse carrying a particular
mutation appeared overall ‘normal’, a normal phenotype
column will be displayed on the far right of the Mammalian Phenotypes section
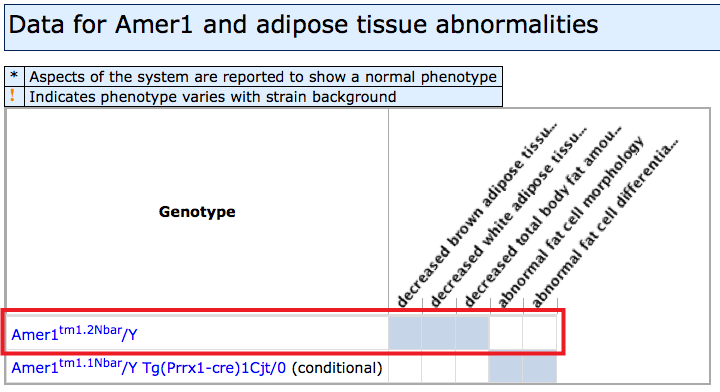
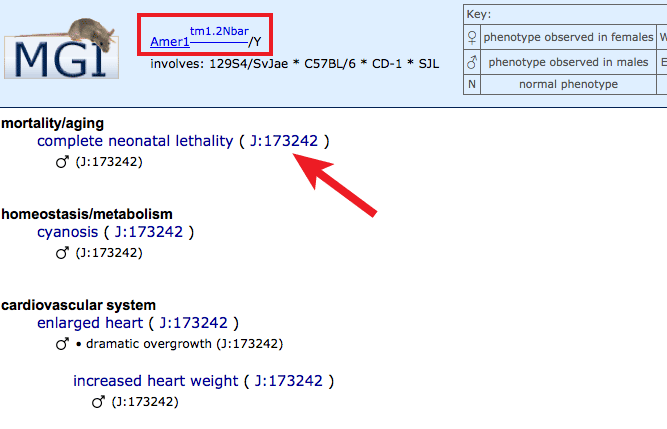
- Filled boxes on Mammalian Phenotypes side: Click individual boxes to
generate a pop-up window with genetic
and phenotypic details. The specific allele pairs and exact phenotypes will be
displayed. Clicking on an allele symbol or row will generate a new window
with the complete list of all phenotype annotations in all systems with
supporting references (J:#s). For help interpreting Allele Detail pages see
here.
- Right side of grid: If mutations in this gene have been associated
with a human disease or reported as a mouse model of a human disease, columns
will appear to the right with colored fill indicating the species.
- Orange filled cells are used if the Gene x Disease association is
supported by human data. Human data annotations come from
OMIM,
NCBI curation,
Gene Reviews,
or Gene Tests.
- If mutant mice have been reported as genetic models for this disease,
a blue fill will be used. MGI curators annotate this data based on author statements
in peer reviewed publications.
- In cases where both mouse genetic models and human clinical cases
support involvement of orthologous (same gene in different species) genes,
a two-toned fill will appear.
- Clear indicates that the intersection of a given gene and human
disease has not been reported.
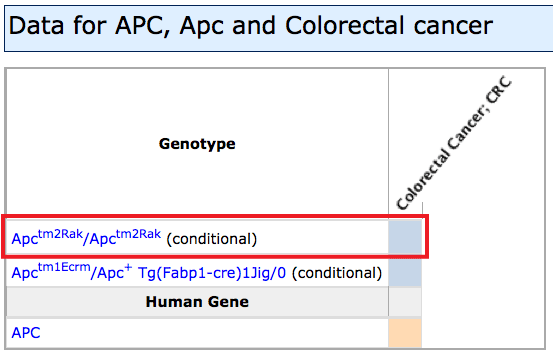
- Filled boxes on Human Disease associations side: Click individual boxes
to generate a pop-up with genetic and disease details. The specific allele
pairs used to model the disease in mice will be displayed. Clicking on an
allele symbol or row will generate a new tab with the complete list of all
phenotype annotations in all systems within this disease model, along with
supporting references (J:#s). Find disease-specific references by clicking
on the J:# in the disease box, as well as links to a
Human Disease and Mouse Model Detail page by clicking on the disease name, or
the OMIM entry for that disease
by clicking on the OMIM ID.
- Unexpected extra diseases may appear in the grid if a phenotype or disease term was
used.
For example, a Disease search for "Alzheimer" will also return "Breast
Cancer" and "Schizophrenia" on the grid. These are returned because
the specific allele pair(s) which match models for "Alzheimer Disease" have
also been reported to exhibit the characteristic phenotypes of these other diseases:
Cav1tm1Mls/tm1Mls for both Alzheimer Disease and Breast Cancer, and
Plcb1tm1Hssh/tm1Hssh for Alzheimer Disease and Schizophrenia.
Use the filters to hide if these are not of interest, or go to the Diseases tab
to see only those diseases which matched the original search terms with their
gene annotations.
[return to top]
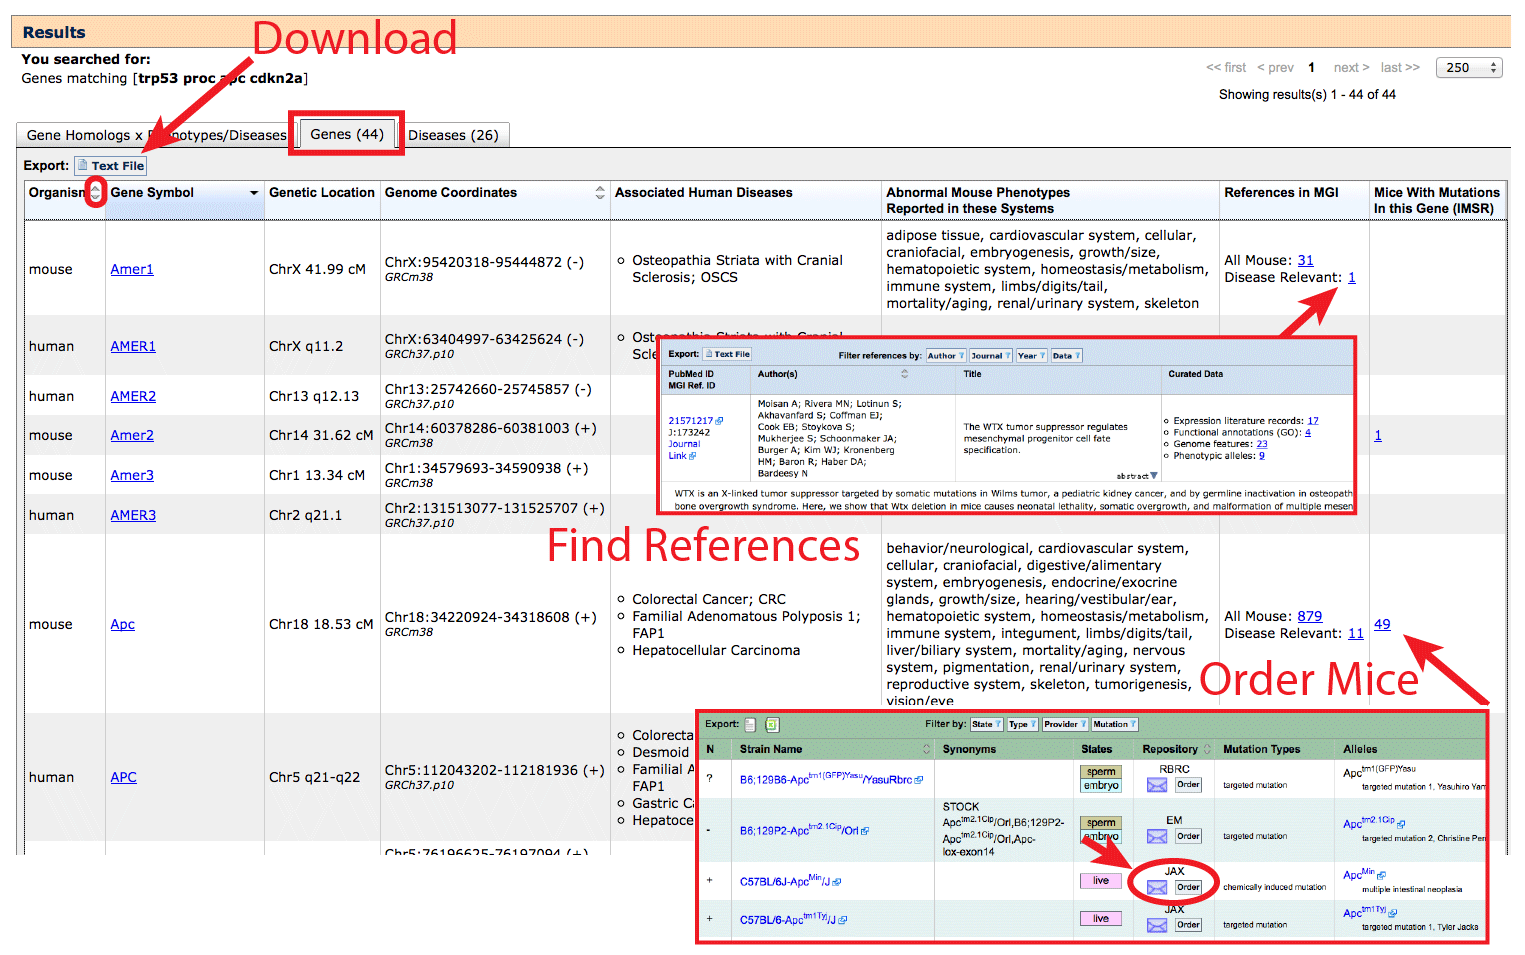
2. Genes tab
On the Genes tab, the complete list of genes will be returned, with human and mouse
homologs listed on separate rows (see column 1: Organism). You may also note
that human gene standard nomenclature is in uppercase (ex. AMER1) while mouse genes are
written in sentence case (ex. Amer1). Genes matching your query but with no reported
phenotypes or diseases will be included on this tab only, so you may see genes here
that do not appear on the grid view.
- To filter this list, apply filters on the "Gene Homology x Phenotypes/Diseases"
tab.
- This table may be sorted by using the arrows in certain column headers, and
data on this table (filtered or unfiltered) can be downloaded using the button indicated.
Columns in the download are tab delimited and multiple "Associated Human Diseases" or "Abnormal
Mouse Phenotypes Reported in these Systems" terms are pipe separated (|).
- Click on the Gene Symbol in the second column to go to a mouse Gene Detail
Page on MGI in rows where "Organism: mouse" or
Vertebrate Homology Page in rows where "Organism: human". Example:
mouse Apc
and human APC.
- The Associated Human Diseases column in a row that corresponds to Organism:
mouse will list diseases where mutant mice have been reported to display
phenotypes and symptoms matching the human disease. This also corresponds to a blue
filled cells in the right half "Gene homology x Phenotypes/Diseases" grid on the
previous tab.
- The Associated Human Diseases column in a row that corresponds to Organism:
human indicates that mutations have been reported in human clinical cases of
this disease, or that variant associations have been made in human populations.
This corresponds to orange filled cells in the right half of the grid.
- The References in MGI column provides a list of all MGI-curated references for
a gene, as well as a sub-list of Disease Relevant publications, where a mouse was
specifically reported by the authors as a model for one of the diseases represented
in the Associated Human Diseases column. Reference pages contain the full citation,
abstract, curated data, and direct links to the paper itself. These references
will focus on mouse genetic models as MGI does not curate human-only data.
- The Find Mice (IMSR) column on the Genes tab contains links to the
International Mouse Strain Resource (IMSR)
which is a database indexing the major public and commercial mouse repositories.
The hyperlinked number indicates how many mouse strains carrying mutant alleles of
a gene are available for purchase. This may link to multiple unique alleles
and allele types. Use the Alleles column to see which allele is present
before placing an order to ensure that the expected phenotypes will be found. Order forms for each
strain are linked in the Repository column in the IMSR (see arrow). If the
"Find Mice (IMSR)" column on the Genes tab is blank, or the repositories listed with the IMSR do not
distribute your preferred model, it may be possible to obtain
mice by directly contacting the corresponding author of a publication which developed
the line. See the Original Reference at the bottom of MGI's Allele Detail pages.
[return to top]
3. Diseases tab
Similar to the Genes tab, the Diseases tab returns a complete list of gene–associated
human disease terms, compiled from both human data and mouse models. If a
gene or transgene is listed in the Associated Mouse Markers column, this
indicates a mouse disease model has been reported for that Gene x Disease pair. If
a gene is listed in the Associated Human Markers column, a variant of this
gene has been implicated in human association studies or clinical cases. If an OMIM
autocomplete term was used as the starting search term, the list will be restricted
to the disease(s) specified, including if no gene associations have been reported.
If a phenotype term, gene symbol or position was used to run the search, all
diseases associated with the matched genes will be displayed.
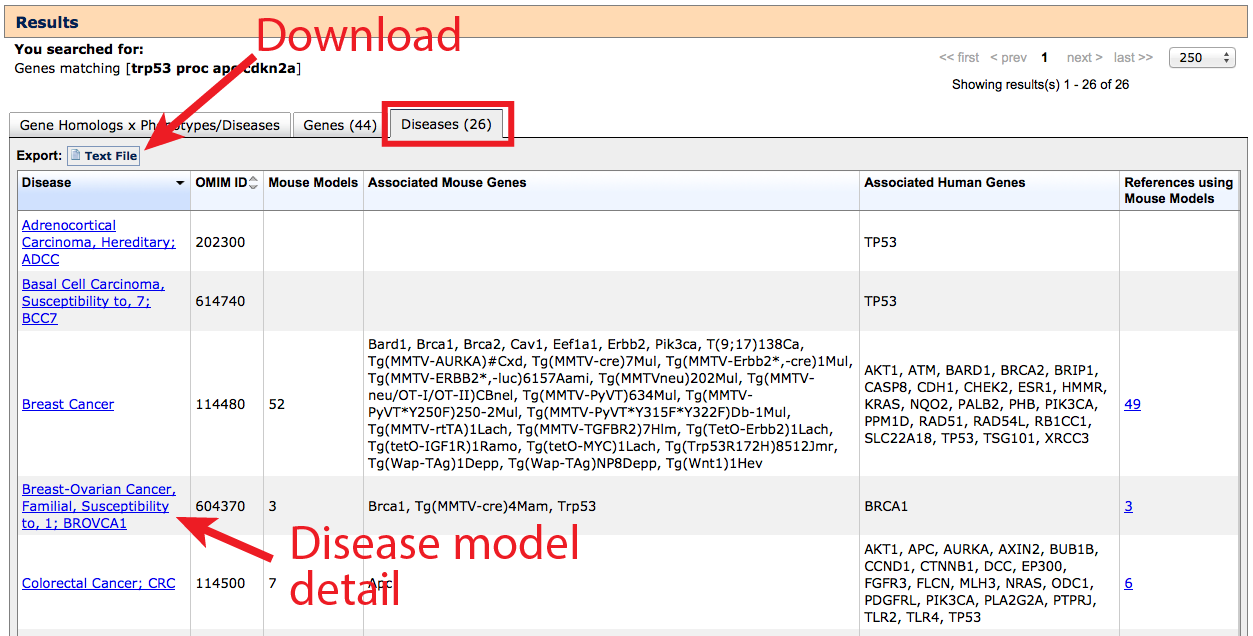
- The data displayed on this table can be downloaded using the button indicated.
- The references column contains a list of publications where authors have
specifically reported that mutant or transgenic mice have been used to model the
characteristic phenotypes of the disease.
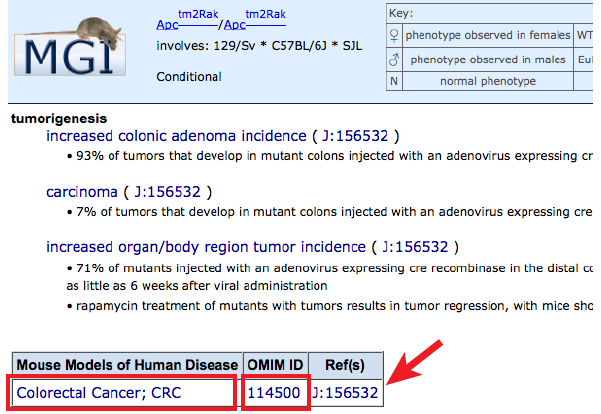
- Click on the hyperlinked disease term to go to a Human Disease and Mouse
Model Detail page where gene links and genotype or allele specific information
can be viewed by clicking in the Mouse Models column.
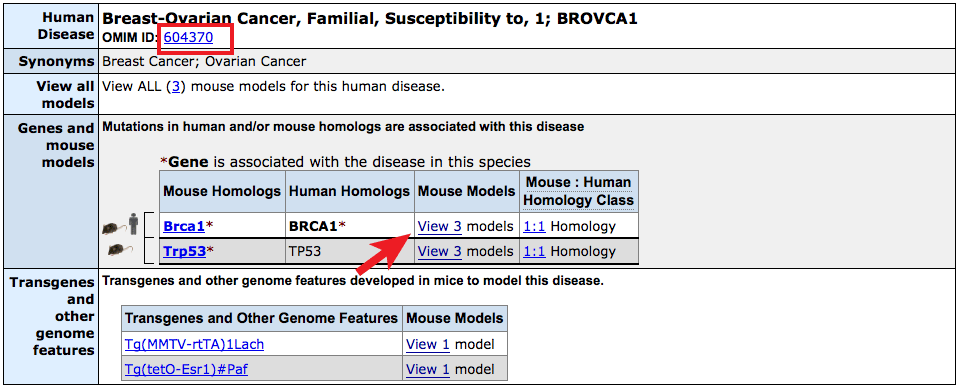
- The Human Disease and Mouse Model Detail page on MGI displays genes
associated with human data or mouse models as before, this time delineated
into up to three classes for "Associated in both", "Associated in mouse models",
and "Associated in human" indicated by the human and/or mouse graphics.
- The OMIM entry for this disease can be reached by clicking on the
OMIM ID number just beneath the header.
|
 |
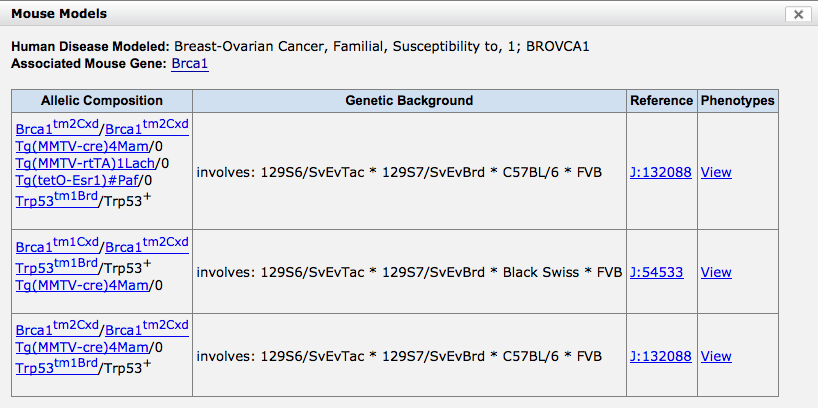
- Clicking on the links in the Mouse Models column will
reveal details of the mouse genotype used as model, at least one
supporting reference and a link to a view of all phenotypes
that have been observed in mice with this combination of mutant
alleles and transgenes (where applicable).
|
|
[return to top]
Uploading a vcf File
A vcf file is a file format used to store gene sequence variations by position. Typically,
these are the result of whole genome or exome sequencing. The format must include:
- Column 1: CHROM - chromosome number
- Column 2: POS - variant position in basepairs.
PLEASE ENSURE THAT THESE POSITIONS ARE BASED ON GRCh37 (HUMAN) OR GRCm38 (MOUSE).
[Convert]
- Column 3: ID - if the variant is known, a refSNP or other reference identifier
will appear. If unknown, this column may be blank or contain "."
- Column 4: REF - the reference allele based on alignment to a reference genome.
- Column 5: ALT - the alternative allele that was detected in the sample
- Column 6: QUAL - a quality score for sequence reads and base calling
- Column 7: FILTER - indicates that the call is of sufficient confidence for
the filters and thresholds applied during analysis. "PASS", some other quality score,
blank or may contain "."
- Column 8: INFO - includes descriptors of the variant
- Column 9: FORMAT - includes descriptors of the genotyping depth and quality
- Column 10... Sample1 - sample data. If more than one individual was sequenced,
each sample is arranged in a new column.
If you edit your file, please clear column data rather than removing columns.
See sample files for:
Human and
Mouse.
In this beta release...
The HMDC does not offer filtering or variant specific analyses in our initial release,
but rather applies phenotype and disease terms to the genes and homologs which are represented.
Note that this will return phenotypes associated with genes even if the SNP variant is
benign. For this reason, we have set the default to filter out all variants that have a
known rs:# or other identifiers in column 3 (ID), as well as reject all variants that
are not tagged as "PASS" in column 7 (FILTER). We also strongly
encourage users to pre-filter by presumed functional impact or on the basis of linkage
(where possible) using a tool such as
Exomiser.
These filters allow a phenotypic annotation to de novo, unreported (rare) or private
gene variants. If your experimental design requires that known variants be included, you can
bypass the ID filter by clearing column 3 in your uploaded file.
Maximum upload file size is 25MB. Only the first 100,000 lines will be processed.
This form has only been tested with VCF v4.0 and higher standard formats.
Please contact MGI
User Support to suggest important features that you would like to see implemented in
future releases.
[return to top]


