Phenotypes associated with this allele
|
|
| Find Mice |
Using the International Mouse Strain Resource (IMSR)
Mouse lines carrying:
Ednrbtm1.1Nrd mutation
(0 available);
any
Ednrb mutation
(103 available)
|
|
|
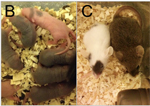
The Ednrbtm1.1Nrd/Ednrbtm1.1Nrd pups are smaller and have black spots due to a melanin pigmentation defect
mortality/aging
|
|
• mice die at around weaning age (~21 days)
|
growth/size/body
|
|
• mice are significantly smaller than control littermates
|
|
|
• mice grow progressively weaker than wild-type controls
|
pigmentation
|
|
• P3 pups show black spots due to a melanin pigmentation defect
|
|
|
• mice exhibit a white coat color with black patches as early as P3
|
digestive/alimentary system
|
|
• mice exhibit megacolon due to abnormal dilation of the colon
|
integument
|
|
• P3 pups show black spots due to a melanin pigmentation defect
|
|
|
• mice exhibit a white coat color with black patches as early as P3
|
Allelic
Composition |
Ednrbtm1.1Nrd/Ednrb+
|
|
Genetic
Background |
involves: 129S1/Sv * 129X1/SvJ * C57BL/6 |
|
| Find Mice |
Using the International Mouse Strain Resource (IMSR)
Mouse lines carrying:
Ednrbtm1.1Nrd mutation
(0 available);
any
Ednrb mutation
(103 available)
|
|
|
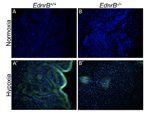
Under severe hypoxia, the relative hypoxic area in the heart is lower in Ednrbtm1.1Nrd/Ednrb+ mice
homeostasis/metabolism
cardiovascular system
 |
• in response to severe hypoxia (10% or 5% O2), heterozygotes show no significant change in cardiac output, unlike wild-type controls where cardiac output is reduced to about half of baseline levels
• however, no significant differences are observed at baseline or under mild hypoxia (21% or 15% O2) relative to wild-type controls
|
|
|
• heterozygotes exhibit a higher dP/dtmax/Ved (maximum rate of pressure change per ventricular end-diastolic volume) at baseline as well as under all subsequent hypoxia exposures (15%, 10% or 5% O2) relative to wild-type controls
|
|
|
• under severe hypoxia (10% or 5% O2), heterozygotes maintain a steady (and thus higher) cardiac output relative to wild-type controls where cardiac output is decreased to about half of baseline levels
• heterozygotes exhibit a higher dP/dtmax/Ved value, indicating higher cardiac contractility, at baseline as well as under all hypoxia exposures (15%, 10% or 5% O2) relative to wild-type controls
|
|
|
• in response to 30 min of severe hypoxia (5% O2), all heterozygotes show tolerance to hypoxia-induced hypotension (defined as MAP <40 mmHg) displaying an average MAP 60.5 +/- 53 mmHg, whereas none of wild-type controls are able to maintain MAP >40 mmHg for the entire 30-min period
|
muscle
|
|
• heterozygotes exhibit a higher dP/dtmax/Ved (maximum rate of pressure change per ventricular end-diastolic volume) at baseline as well as under all subsequent hypoxia exposures (15%, 10% or 5% O2) relative to wild-type controls
|
 Analysis Tools