|
|
|
|
|
|
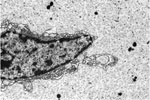
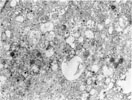
| 145. Electron Micrograph of Pituitary Cystoid Degeneration | 146. Ectopic Thyroid at Base of Heart |
147.
Calcium Oxalate Crystals -Thyroid (Bright Field) |
148.
Calcium Oxalate Crystals -Thyroid (Bright Field and Dark Field) |
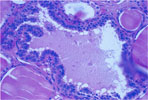
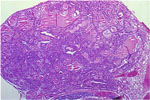
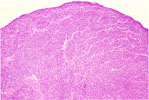
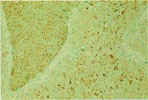
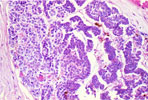
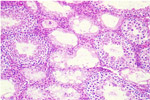
149. Focal Thyroid Follicular Hyperplasia | 150. Thyroid Papillary Adenoma |
|
|
|
|
|
|
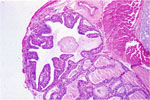
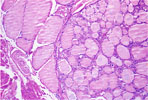
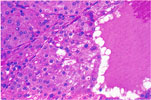
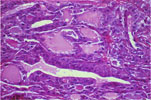
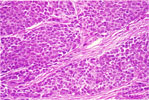
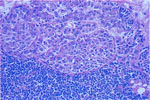
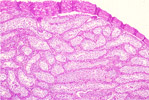
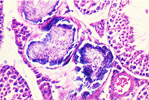
| 151. Thyroid Follicular Adenoma | 152. Thyroid Solid Carcinoma | 153. Thyroid Papillary/Follicular Carcinoma | 154. Thyroid Papillary/Follicular Carcinoma | 155. Thyroid Medullary (C-Cell) Carcinoma | 156. Thyroid Medullary (C-Cell) Carcinoma |
|
|
|
|
|
|
|
157.
Thyroid Medullary (C-Cell) Carcinoma -Calcitonin (Immunoperoxidase) |
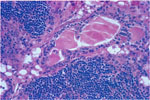
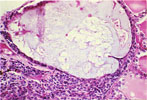
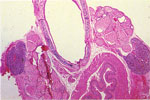
158. Ectopic Parathyroid in the Thymus | 159. Parathyroid Cyst | 160. Bilateral Parathyroid Hyperplasia | 161. Parathyroid Adenoma |
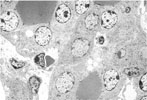
162.
Electron Micrograph -Normal C-Cells |
|
|
|
|
|
|
|
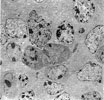
163.
Electron Micrograph -Normal C-Cells |
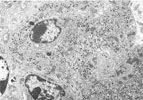
164.
Electron Micrograph -Medullary (C-Cell) Carcinoma |
165.
Electron Micrograph -Medullary (C-Cell) Carcinoma |
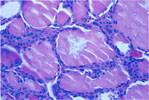
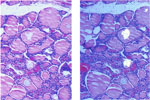
166. Testicular Atrophy (Focal) | 167. Testicular Atrophy (Diffuse) | 168. Testicular Mineralization |