|
|
|
|
|
|
|
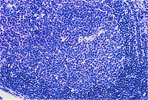
289.
Lymphoid Follicular Hyperplasia -Lymph Node |
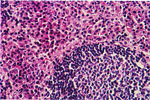
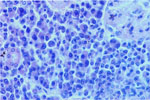
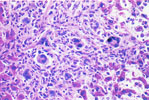
290.
Plasmacytosis -Lymph Node |
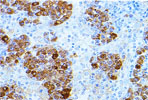
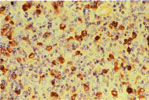
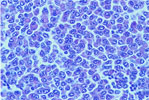
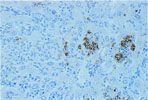
291.
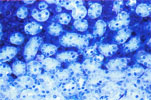
Plasmacytosis -Lymph Node (Immunoperoxidase for IgG) |
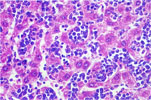
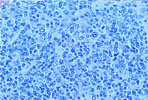
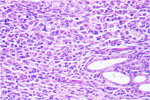
292.
Lymphoblastic Lymphoma -Liver |
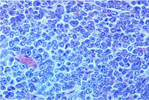
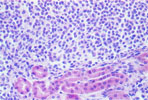
293.
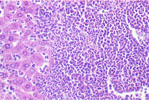
Lymphoblastic Lymphoma -Thymus |
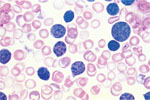
294.
Leukemia -Lymphoblastic Lymphoma |
|
|

|
|
|
|
|
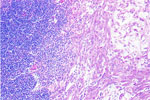
295.
Follicular Center Cell Lymphoma -Spleen |
296.
Follicular Center Cell Lyphoma -Spleen (Immunoperoxidase for IgG) |
297.
Follicular Center Cell Lymphoma -Lymph Node |
298.
Plasma Cell Lymphoma -Liver |
299. Immunoblastic Lymphoma |
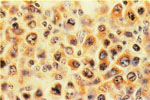
300.
Immunoblastic Lymphoma -Cytoplasmic Immunoglobulin |
|
|
|
|
|
|
|
301.
Thymoma -Epithelial Component |
302.
Histiocytic Sarcoma -Liver |
303.
Histiocytic Sarcoma -Liver (Alpha 1-Antitrypsin) |
304.
Histiocytic Sarcoma -Uterus |
305.
Mast Cell Tumor -Kidney (H & E) |
306.
Mast Cell Tumor -Kidney (Toluidine Blue) |
|
|
|
|
|
|
|
307.
Granulocytic Leukemia -Liver |
308.
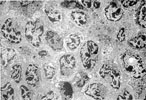
Electron Micrograph -Histiocytic Sarcoma (TEM) |
309.
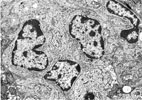
Electron Micrograph -Histiocytic Sarcoma (TEM) |
310.
Mites -Skin |
311.
Squamous Cell Papilloma -Skin |
312.
Basal Cell Carcinoma -Skin |