|
|
|
|
|
|
|
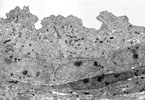
265.
Electron Micrograph -Normal Urothelium (TEM) |
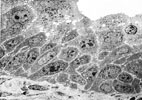
266.
Electron Micrograph -Urothelial Hyperplasia (TEM) |
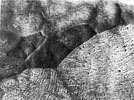
267.
Electron Micrograph -Urothelial Hyperplasia (SEM) |
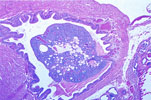
268.
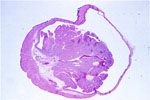
Papilloma (Pedunculated) -Urinary Bladder |
269.
Papilloma (sessile) -Urinary Bladder |
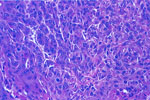
270.
Transitional Cell Carcinoma -Urinary Bladder |
|
|
|
|
|
|
|
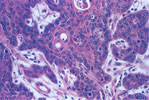
271.
Transitional Cell Carcinoma with Squamous Metaplasia -Urinary Bladder |
272.
Pulmonary Metastasis -Urinary Bladder, Transitional Cell Carcinoma |
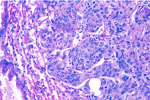
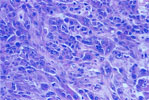
273.
Undifferentiated Carcinoma -Urinary Bladder |
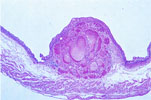
274.
Hemangioma -Urinary Bladder |
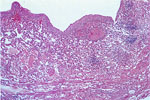
275.
Hemangiosarcoma -Urinary Bladder |
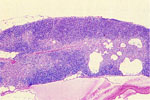
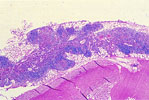
276.
Cysts -Thymus |
|
|
|
|
|
|
|
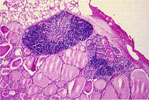
277.
Atrophy -Thymus |
278.
Ectopic Thymus -Parathyroid |
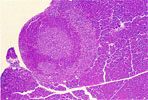
279.
Accessory Spleen -Pancreas |
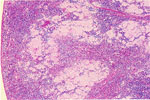
280.
Amyloidosis -Spleen |
281.
Hemosiderosis -Spleen |
282.
Melanosis -Spleen |
|
|
|
|
|
|
|
283.
Follicular Hyperplasia -Spleen |
284.
Erythrocytic Hyperplasia -Spleen |
285.
Granulocytic Hyperplasia -Spleen |
286.
Megakaryocytosis -Spleen |
287.
Atrophy -Bone Marrow |
288.
Sinus Histiocytosis -Lymph Node |