| Overview |
You can use the Gene Expression Standard or Expression Profile Search in order to find expression data for a tissue, gene or set of genes.
See FAQ below for details on how to:
- find expression data for a specific gene and tissue? FAQ
- find genes expressed in one tissue but not expressed, or not reported, in another? FAQ
- find all expression data for a tissue using the Mouse Developmental Anatomy Browser (with, or without, specifying developmental stage)? FAQ
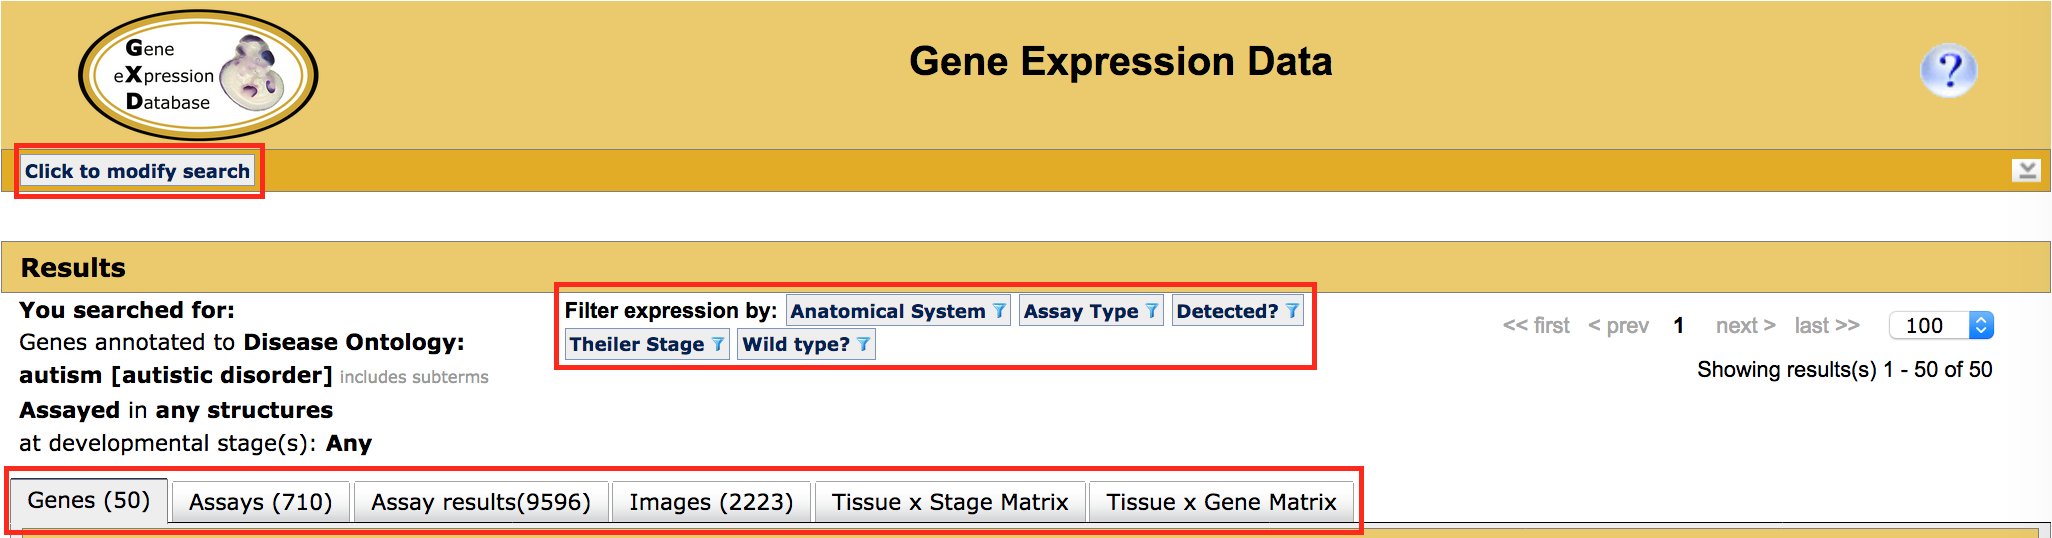
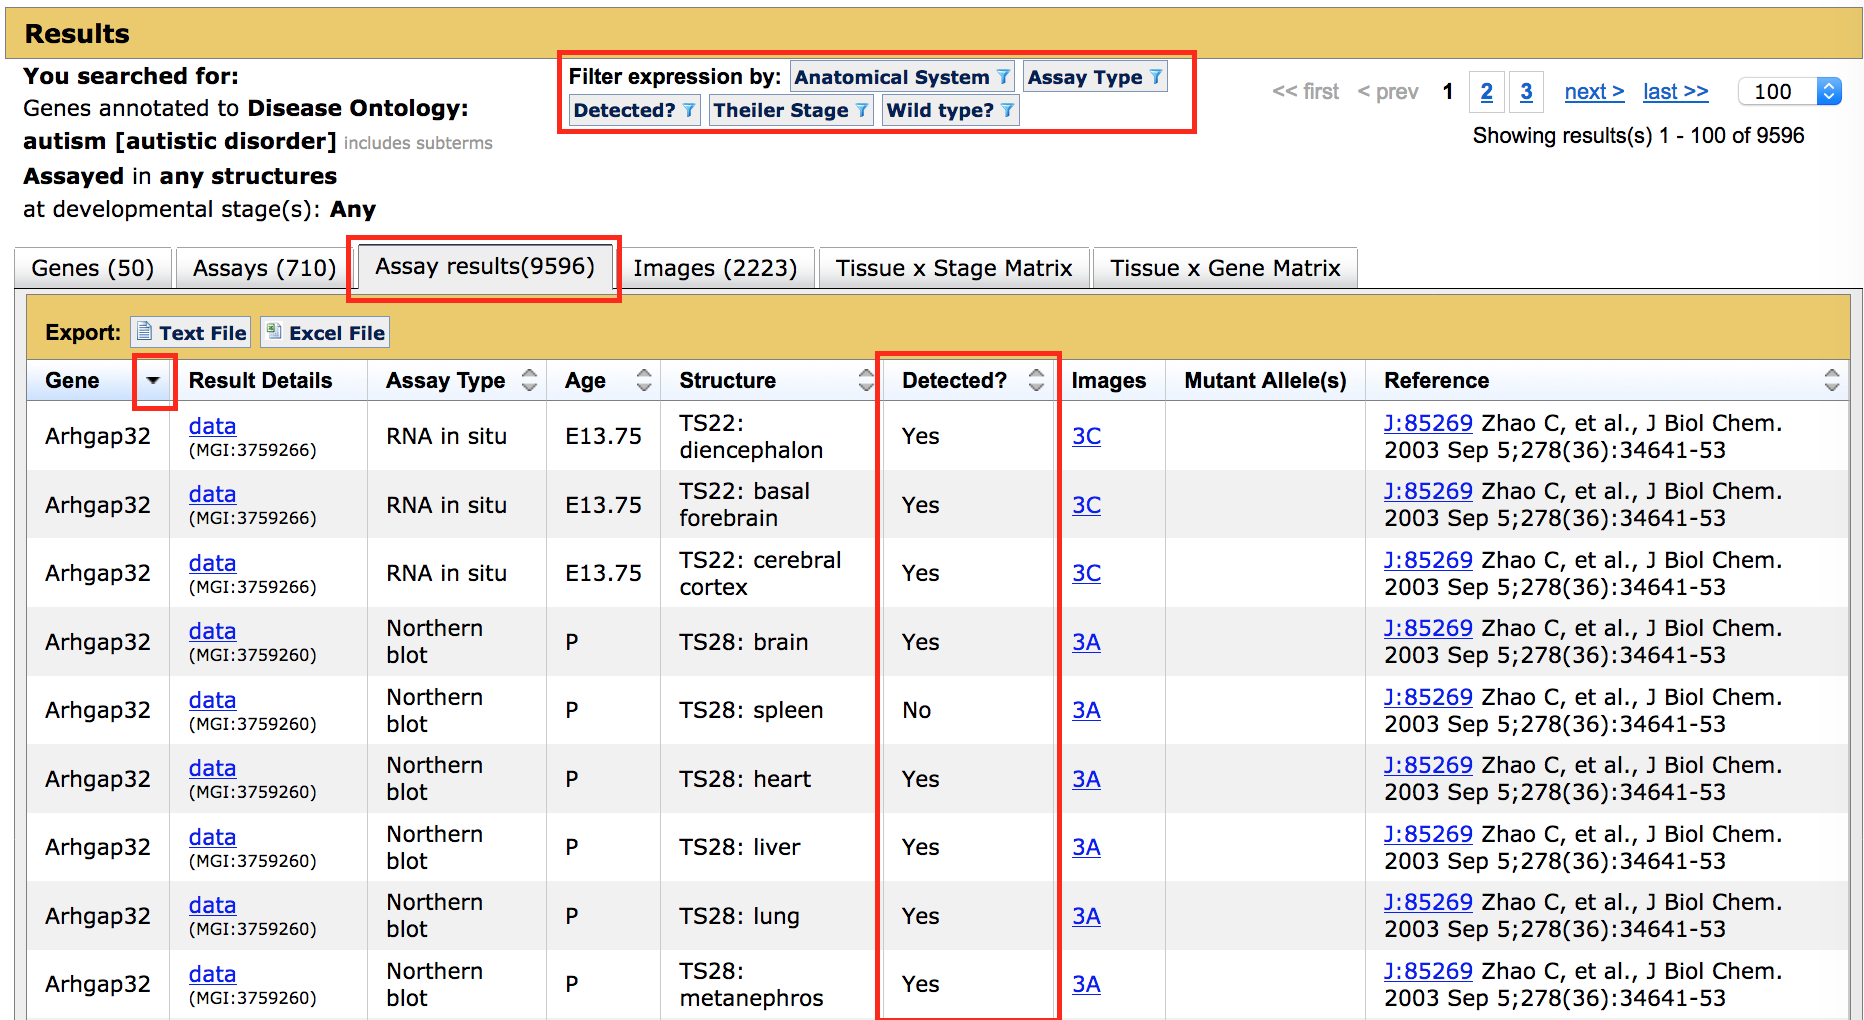
Results from your search will be presented in a table with six tabs, each highlighting a different facet or way to assess the data. Filters appear above the table allowing you to refine the data; if applied, these will filter all tabs. The original search terms and parameters are displayed under the Results header as a reminder. A Click to Modify Search button also appears at the top of the page which will expand your original query form on click, allowing additional changes.
For the examples below, a search for all expression data annotated to genes with an association to autism (via OMIM) was run.
- The Genes tab
- The Assays tab
- The Assay Results tab
- The Images tab
- The Tissue x Stage Matrix tab
- The Tissue x Gene Matrix tab
| Genes Tab | ||
|
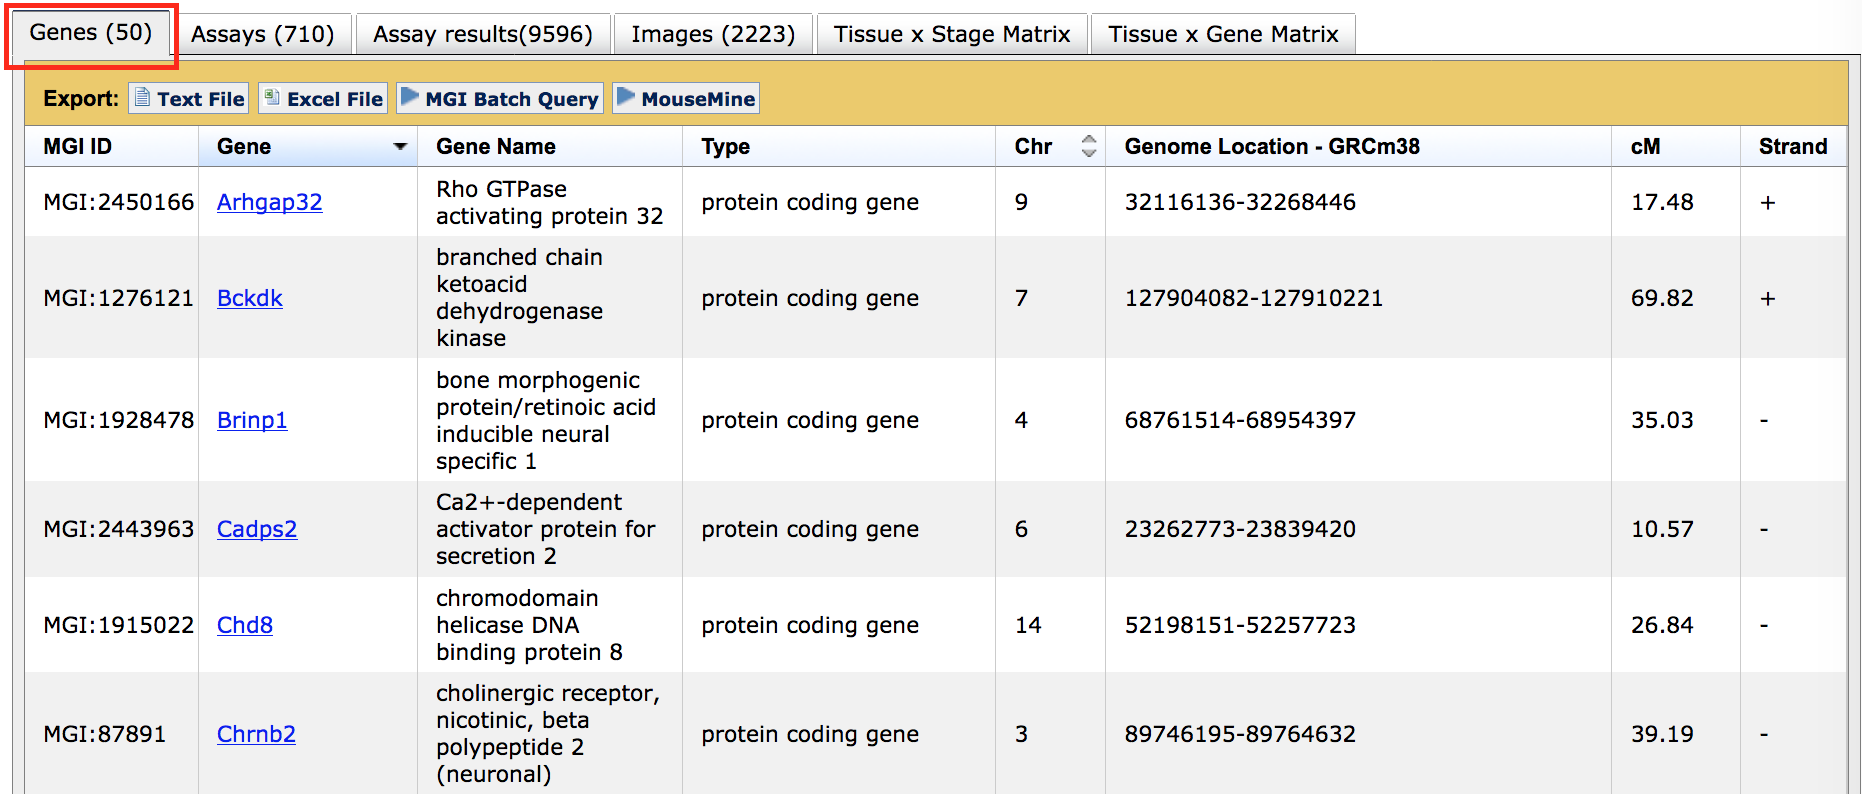
The Genes tab provides a list of the unique genes with expression data represented in these results. The number in the tab header provides a count of all genes. Only genes with at least one gene expression annotation are reported. This list can be downloaded (see buttons just above the table) or forwarded to MGI Batch Query where additional data (alternative IDs, phenotypes, GO functions, etc) can be added. To filter your results by gene, use the gene column filters on the Tissue x Gene Matrix tab. Clicking on Gene Symbols will go to the Gene Detail page within MGI. |
|
|
| Assays Tab | ||
|
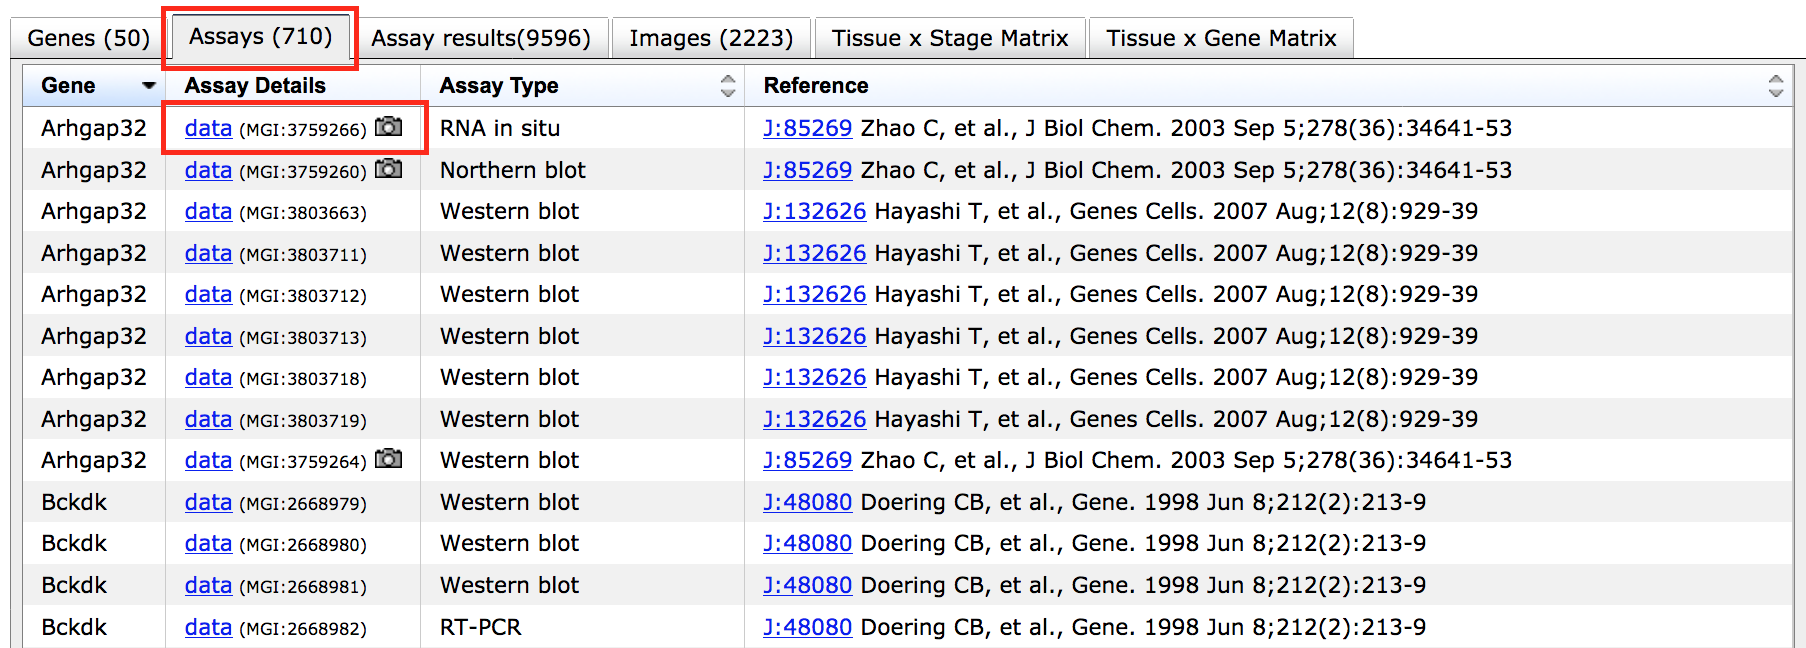
The Assays tab lists every analysis type and data source used by GXD to make a gene expression annotation. These sources include peer-reviewed publications, electronic submissions and batch loads from collaborators doing large scale gene expression projects. Assay records can be sorted by Assay Type, Gene Symbol, or Reference (by J:#) by using the arrows in column headers, or filtered using the Filter expression by: buttons above the tabs. Assay records with associated images are marked by a camera icon. Clicking on "data" within the Assay tab will go to the data that matches that Assay Type, Gene and Reference. The linked Assay Detail page will contain specifics about the specimen(s) used (mouse strain, sex and age where known), probe/antibody ID and preparation (where applicable), a text description of the results curated from author statements (structure qualitative expression patterns and levels) and supporting images. |
|
|
| Assay Results Tab | ||
|
The Assays Results tab is the most comprehensive list of the data within GXD. These results can be sorted using the arrows in most column headers, filtered using the "Filter Expression by:" buttons above the tabs, and downloaded using the buttons on the table just above the data. To filter more precisely by anatomical structures or by gene, use the row and column filters available on the Tissue x Stage Matrix or Tissue x Gene Matrix respectively. Each piece of data is accompanied by a reference and additional details can be found by clicking the "data" hyperlink in the Result details column. Note that a result will be returned for both positive and examined-but-absent gene expression data (see Yes/No in "Detected" column) by default. This can be changed by selecting the radio button corresponding to detected, not detected, or both in the original search parameters, or a filter can be used from above the results table. |
|
|
| Images Tab | ||
|
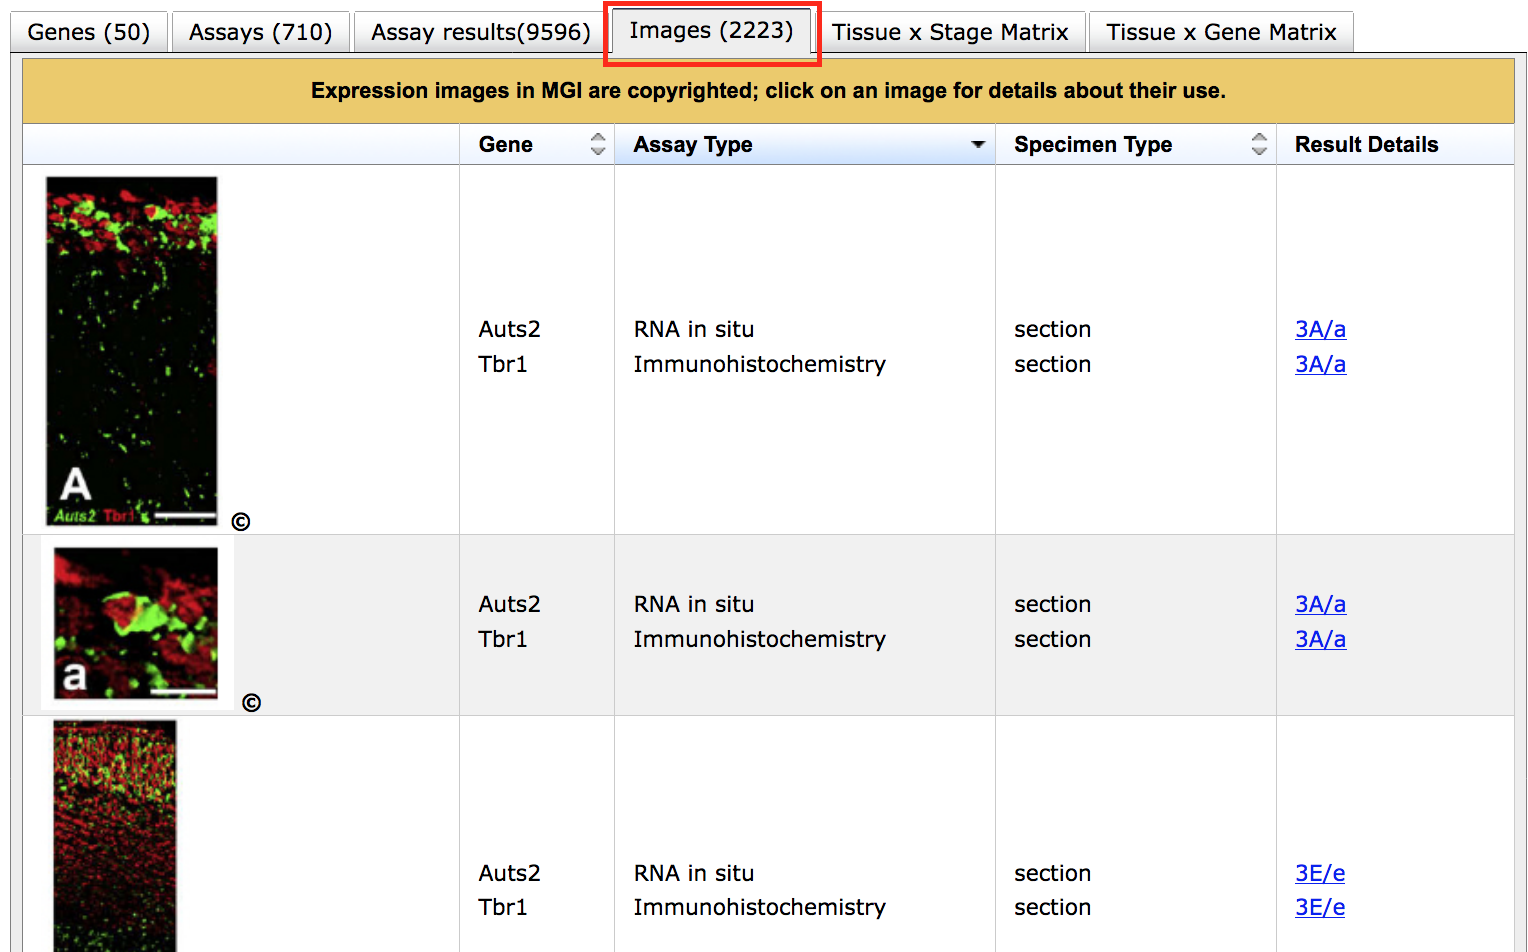
When GXD has permission to reproduce images that support gene expression data annotations. these figures are presented on the Images tab as well as on individual Assay Detail pages. Metadata accompanies each image with the gene(s) assayed, the assay type and a Result details link that brings you to the Assay Detail page with detailed specimen and protocol information. Note that some images have expression data for multiple genes. |
|
|
| Tissue x Stage Matrix Tab | ||
|
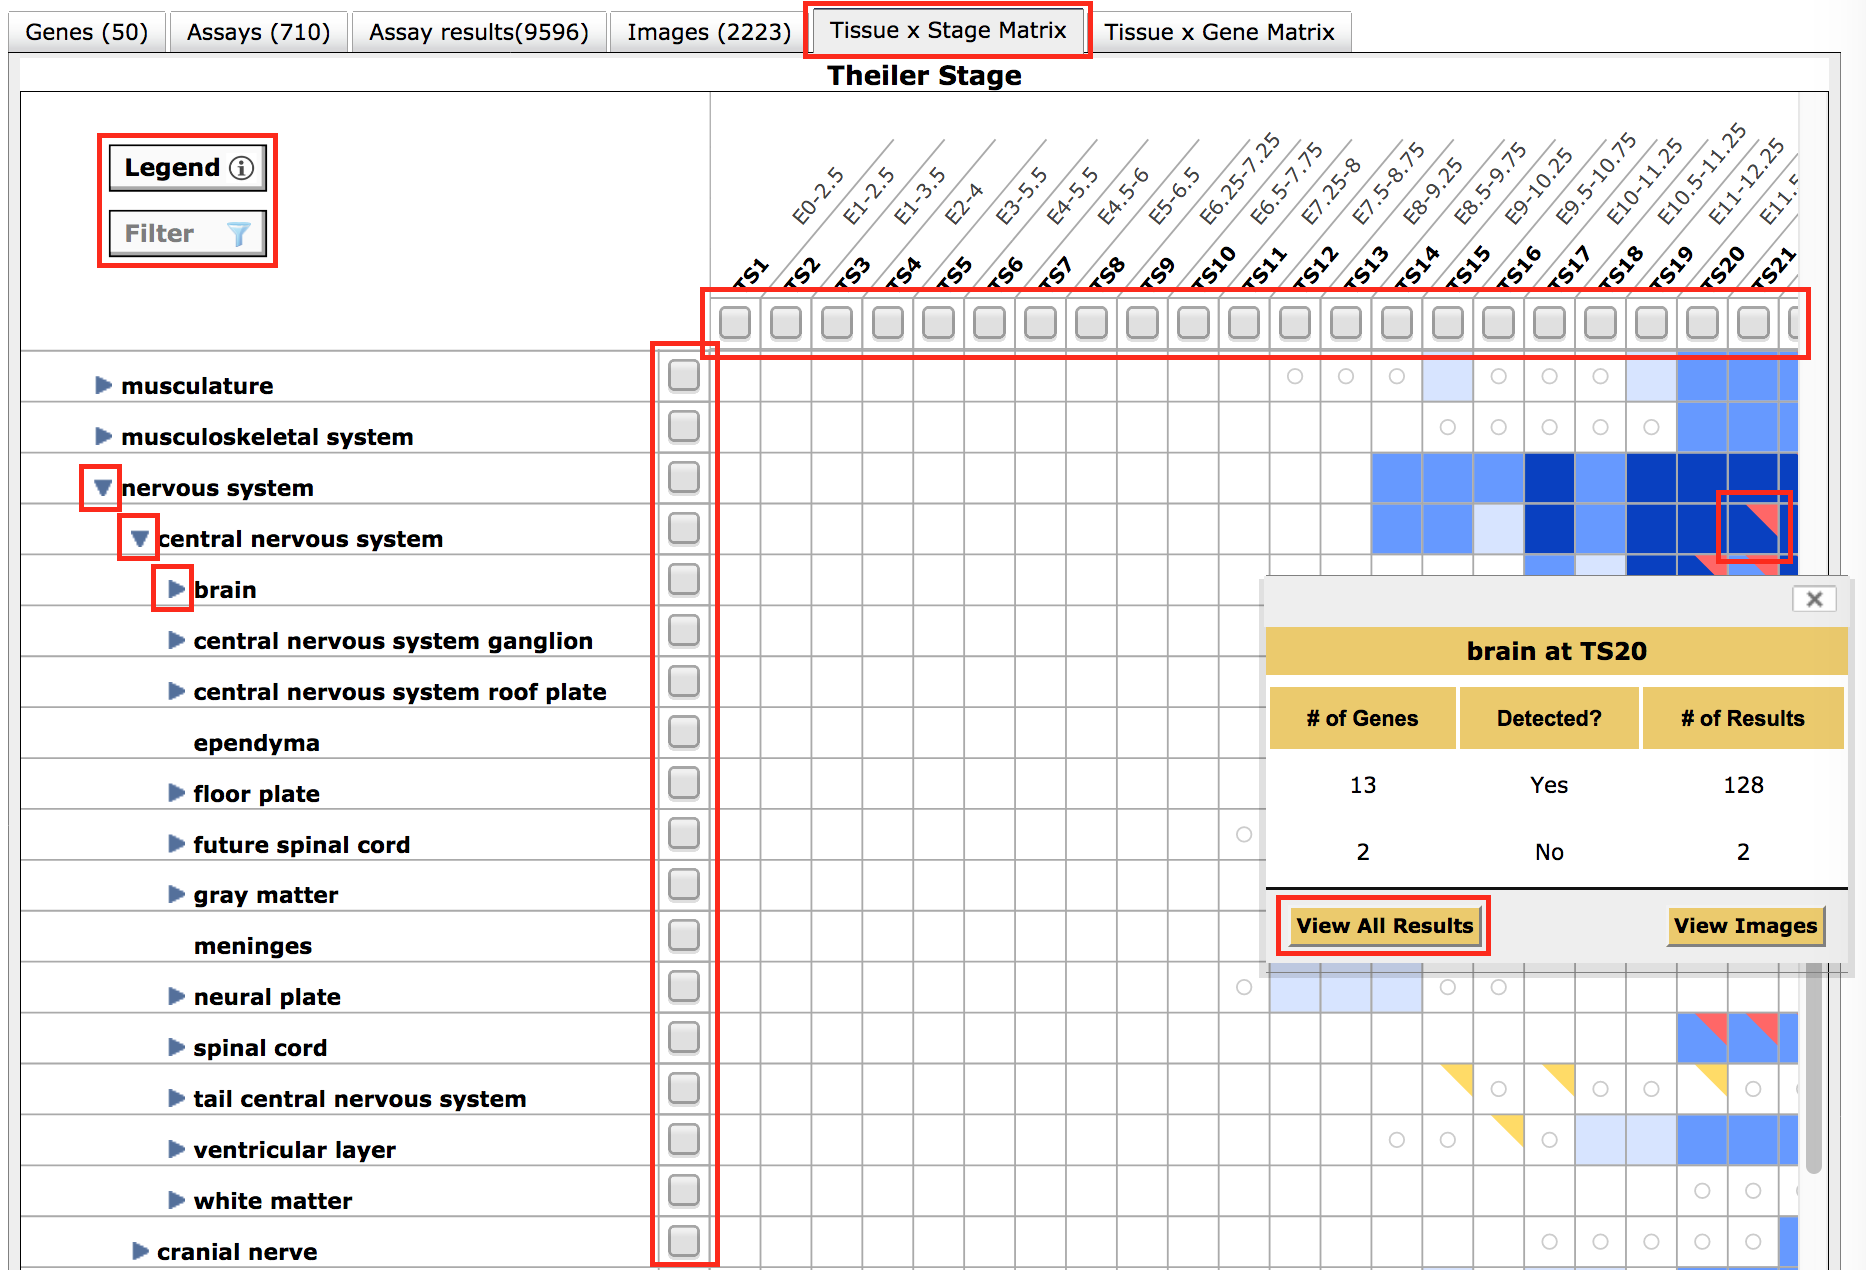
The Tissue x Stage Matrix is an interactive graphical display that provides a global overview of spatio-temporal gene expression patterns. These data are organized into anatomical structures (rows) by Theiler developmental stages (TS; columns). Column headers also display mouse age ranges in embryonic (E) or post-natal (P) days associated with each Theiler stage to aid in interpretation. Use scroll bars to explore down the list of structures. When a triangle appears in front of a term, click to expand substructures within the hierarchical tree. To restrict results by specified stages, structures or substructures, click the box within desired columns or rows to place a checkmark, then click Filter just above the table within the tab. This will retain selected rows/columns only and will filter all tabs simultaneously. Filled boxes indicate that expression data exists for a given tissue x stage intersection: blue if genes are annotated as "detected" or "expressed" within structures or substructures, red where genes are annotated as "not detected" within the structure.
Colors get progressively darker when there are more assays (evidence) supporting a present or absent annotation; darker colors do not denote higher, or lower, levels of expression. See Legend for explanations of all colors. In brief, red corners on blue cells indicate that both present and absent results have been reported for the structure and gold corners are used to indicate that substructures of a given tissue have data reporting absent (red) or ambiguous (grey) expression results. Click triangles next to tissue terms to view substructures, or click cells for a detailed pop-up. White cells in this grid indicate that the tissue does not exist at that stage. If a circle appears within the box, the tissue exists at that stage, but no expression data has been reported. See the complete Mouse Developmental Anatomy Browser at the link. To access the data for specific tissue x stage combination, click the corresponding filled cell to generate a pop-up (shown for "brain" at "TS20"). A table with the number of genes detected and number of genes not detected, along with the number of results supporting those conclusions will appear. To see the data or images associated with this subset, click the buttons on the pop-up table, which will take you to the appropriate tab as well as acting as a filter. |
|
|
| Tissue x Gene Matrix Tab | ||
|
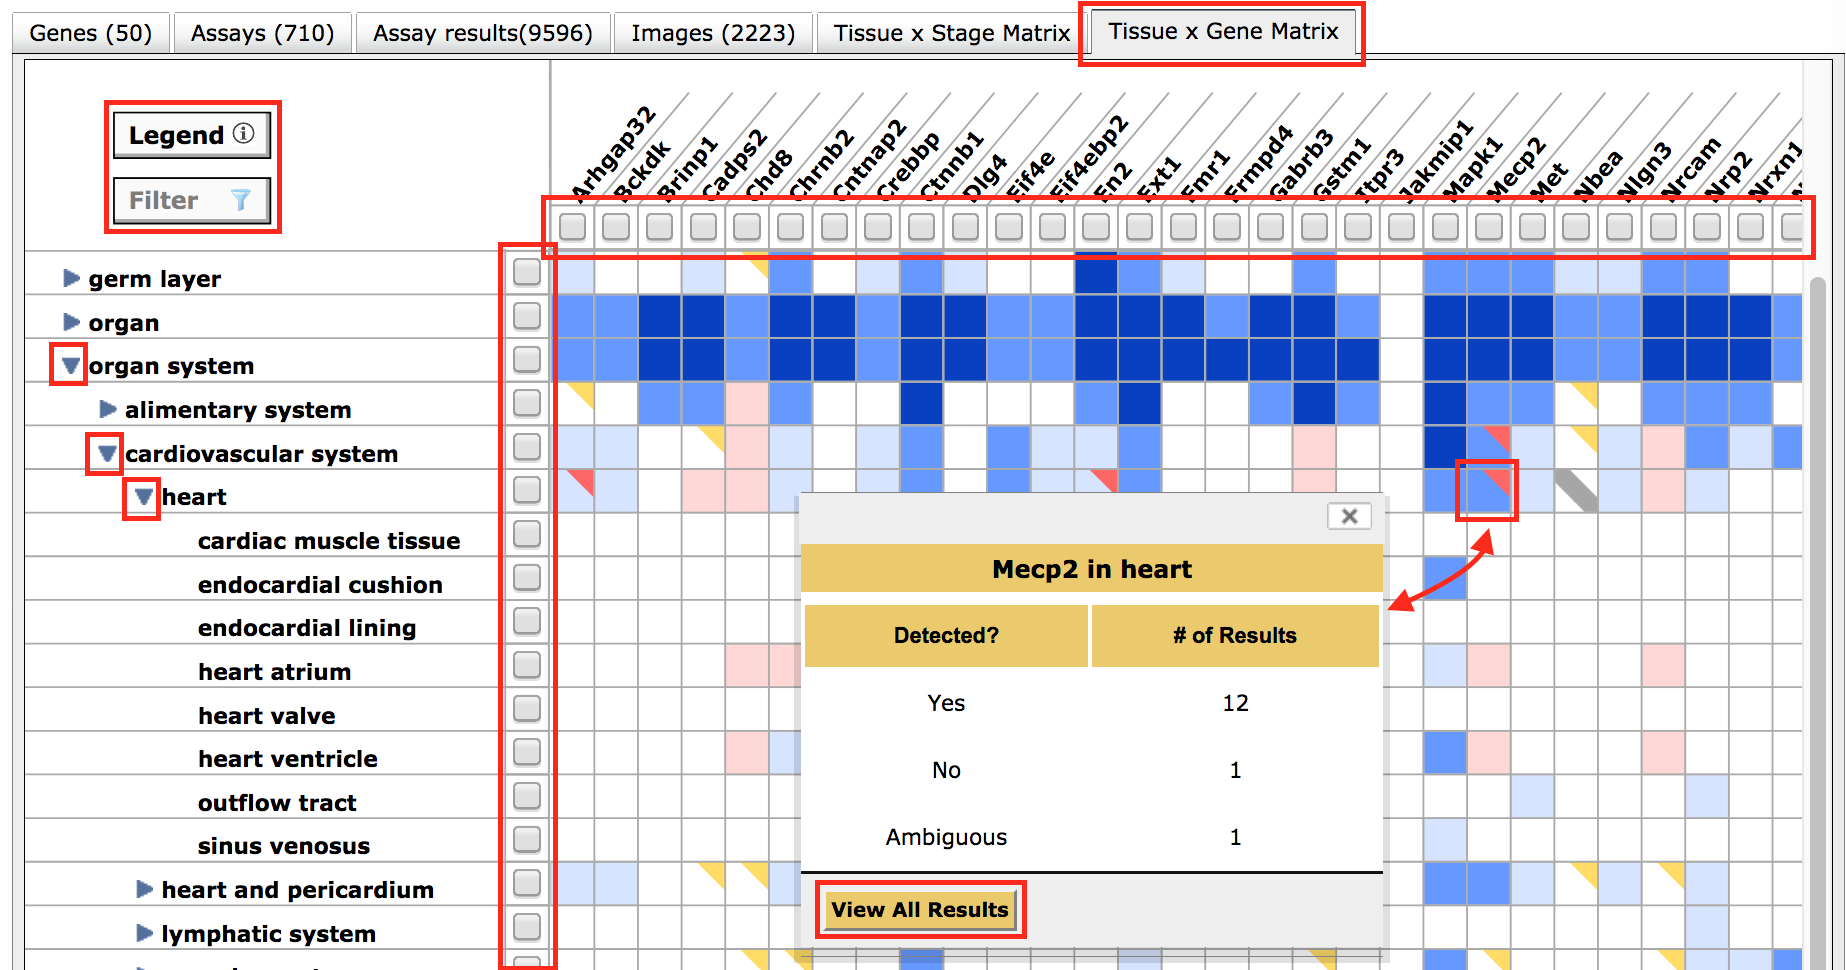
The Tissue x Gene Matrix is an interactive graphical display of gene expression data within GXD that enables a comparison of expression patterns between genes. It is organized into anatomical structures (in rows) by gene symbols (in columns). Use scroll bars to explore down the list of structures. When a triangle appears in front of the term, click to expand substructures. To restrict results by specified genes, structures or substructures, click the box to place a checkmark in selected rows or columns and click the Filter button just above the table on this tab. This will retain selected rows/columns only and filters all tabs. Filled cells in this tab again indicate that expression data exists: blue if genes are annotated as "expressed" within structures or substructures, red where gene expression was examined and not detected within a structure, and white to indicate that no data has been reported for a given tissue and gene combination. Colors get progressively darker when there are more underlying supporting annotations (stronger evidence); varying shades do not denote higher or lower levels of expression.. To see the data for specific tissues and genes, click the corresponding filled cell to generate a pop-up (shown for "Tbx1" in "heart"). A table with the number of results reporting gene expression detected and/or not detected will appear. To access the data or images associated with this subset, click the buttons on the pop-up window which will take you to the appropriate tab as well as acting as a filter. The matrices are overviews of gene expression data projected onto the organization of the anatomy ontology. To see and explore the full anatomy, go to the Mouse Developmental Anatomy Browser. |
|
|