This GO_Slim Chart Tool bins the genes in your list and, for comparison, all annotated MGI genes, according to MGI GO Slim definitions to help you discover what your genes may have in common.
The Gene Ontology (GO) project was established to provide a common language to describe aspects of a gene product's biology. A gene product's biology is represented by three independent structured, controlled vocabularies: molecular function, biological process and cellular component. For more information on GO, see the GO consortium home page .
To provide the most detailed information available, gene products are annotated to the most granular GO term(s) possible. For example, if a gene product is localized to the perinuclear space, it will be annotated to that specific term only and not the parent term nucleus . In this example the term perinuclear space is a child of nucleus . However, for many purposes, such as analyzing the results of microarray expression data, it is very useful to "calculate" on GO, moving up the GO tree from the specific terms used to annotate the genes in a list to find GO parent terms that the genes may have in common. The GO Term Finder tool allows you to do this.
The query page allows you to enter the list of gene names and select the ontology that you want to search.
- Enter gene names:
You can either type the name of the genes in the input box or upload a file that contains the genes names. Note that a long (more than 100 genes) list of genes might take awhile to return your results.- Choose ontology:
Select one of the three (biological process, molecular function, or cellular component) ontologies by checking the boxes. This tool is designed to search only one of the three ontologies at a given time in order to minimize the searching time.- Indicate whether to include IEAs: The IEA code, I nferred from Electronic Annotation, means no human involvement in the assignment of the association and is thus lowest quality evidence code. IEA is the only code currently in use that does not require human judgement during the curation process. Also see the GO evidence code documentation.
- Click the Search button.
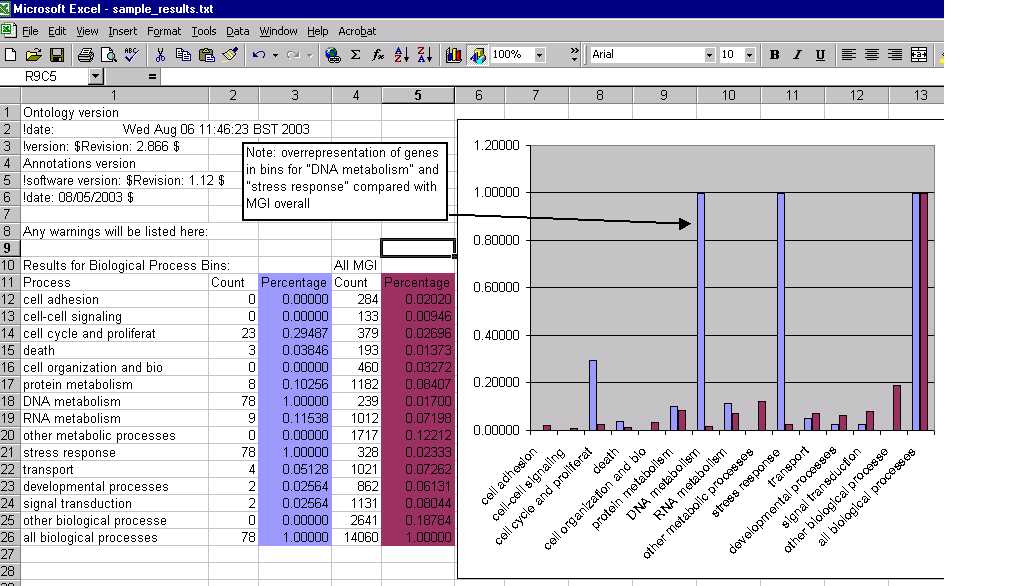
The results page displays in table form, the distribution of genes in pre-defined bins (see MGI GO_Slim definitions ) and a comparison with the overall distribution of all MGI annotated genes. The results page also shows the ontology and annoatation versions used.
- To download a sample text file of genes identified by MGI accession ID, click here . This file can be submitted to MGI GO_Slim Chart tool.
- To view a sample results page with explanation of results, click here .
- To view sample results as an Excel spreadsheet, with chart created in Excel, click here .
This page is adapted from the help page at SMD.