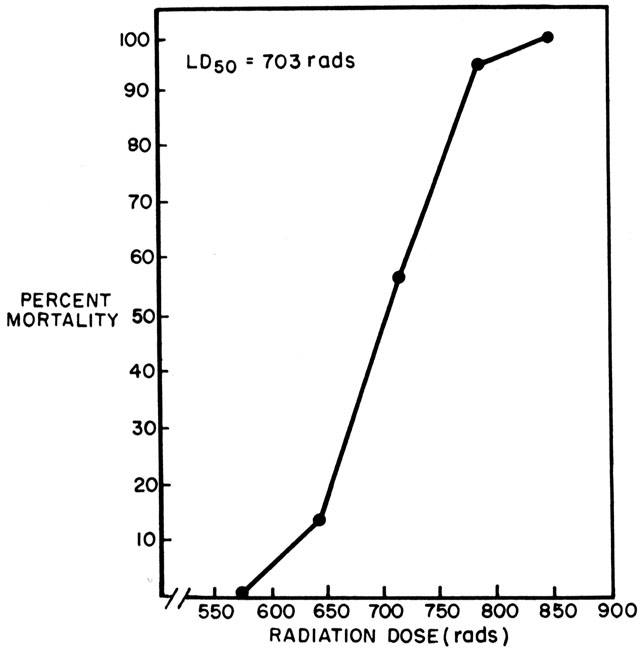
Figure 22-3. Example of dose-response curve. Percentage dead vs. dose. Data for 129/J female mice. (Storer, unpublished data).