How do I search for genes by expression profile?
Overview

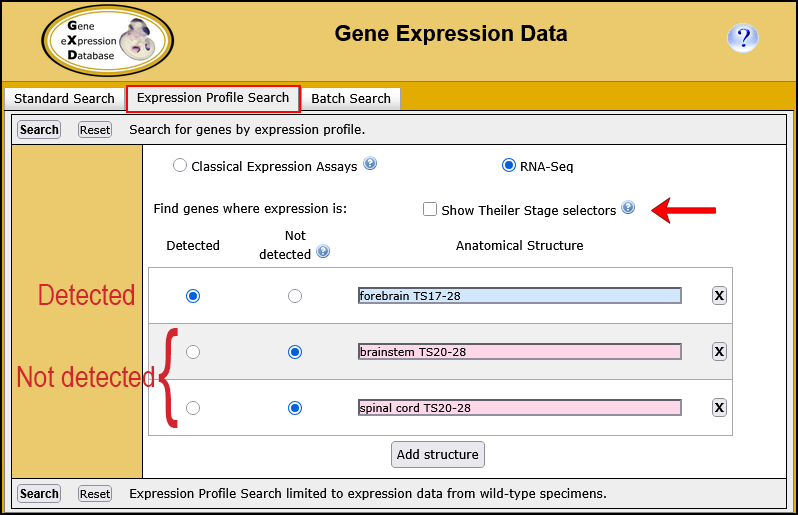
You can use the Expression Profile Search to define the expression profile of interest by specifying up to 10 anatomical structures and whether expression is present or absent in these structures as determined by either classical expression assays or RNA-Seq experiments. In addition, you can also specify the developmental (Theiler) stage(s) of interest.

Accessing the Expression Profile Search
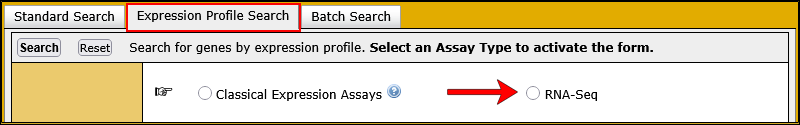
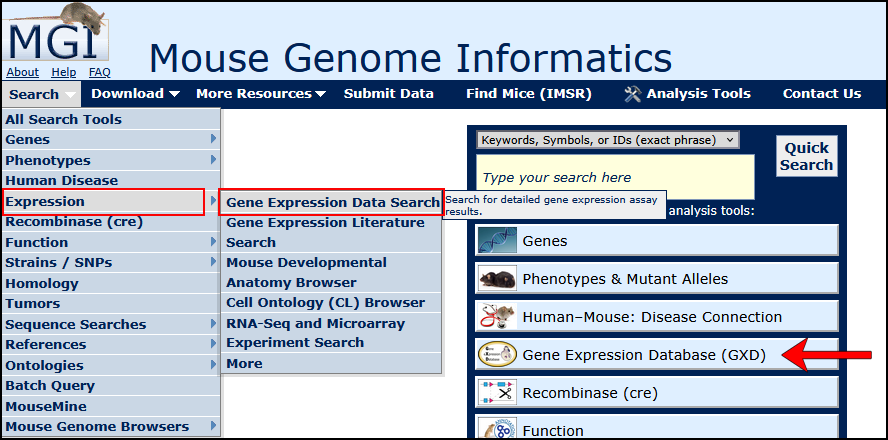
The Expression Profile Search is a tab on the Gene Expression Data Search. On most MGI pages, you can access the Gene Expression Data Search from the Search menu as shown in the image at right.

Alternatively, you can also navigate to the Gene Expression Database (GXD) home page using the tile found on the MGI home page (arrow in image at right). Once there, click on the Expression Profile Search tile.

For this tutorial, open the Gene Expression Data Search Form in a new window. Scroll down this page for further instructions.

Search Menu GXD QF Screen Shot

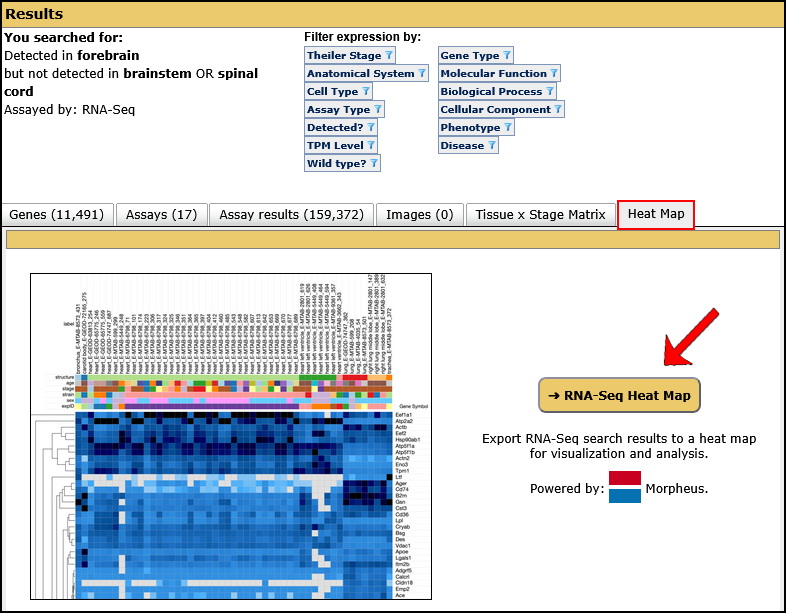
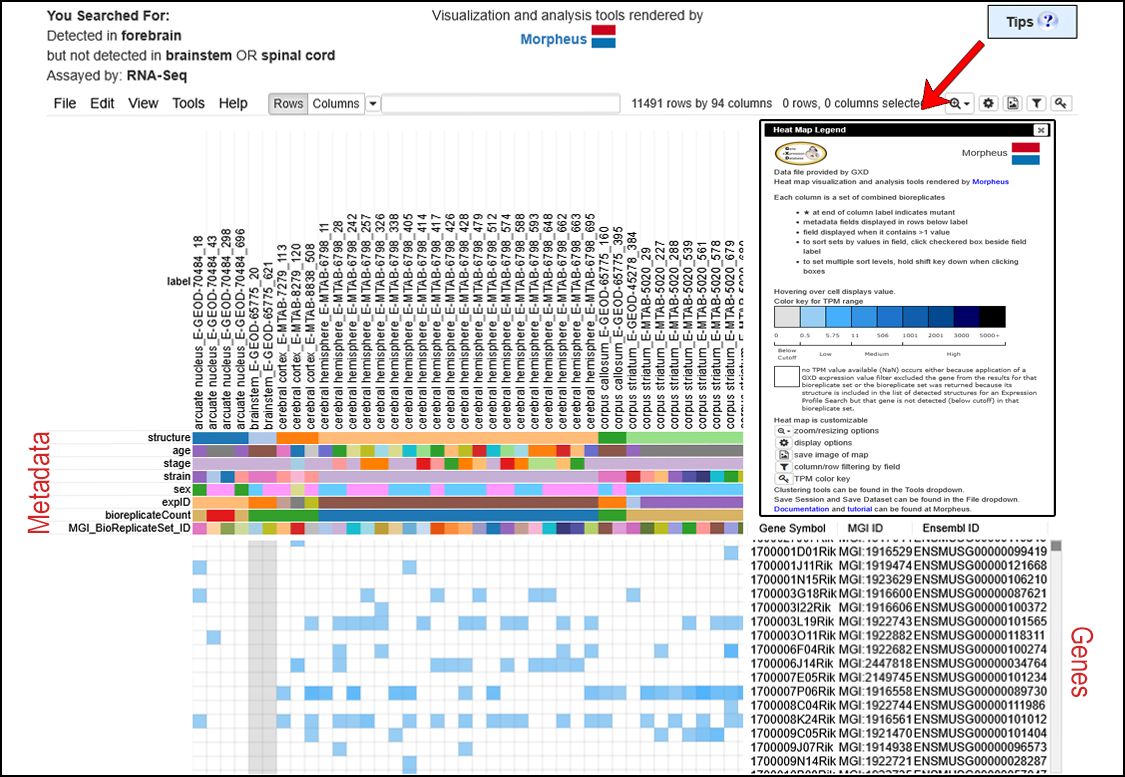
Example. Search for genes expressed in the forebrain but not in the hindbrain or spinal cord as determined by RNA-Seq.
  1. Click on the Expression Profile Search tab (boxed).
  2. Choose the RNA-Seq radio button (arrow) to select the assay type.

    Classical expression assays are RNA in situ, immunohistochemistry, knock-in reporter, Northern blot, RT-PCR and Western blot assays.

Blank Expression Profile Form
  1. To define the expression profile of interest, use the Detected/Not detected radio buttons and type in the anatomical structures of interest.
  2. Click Search.

    The background color for Detected Structures will be blue, Not detected will be red.

    The structure field has an autocomplete list that activates on the second character.

    If you also want to specify developmental stages, check “Show Theiler stage selectors” (arrow). You can define search profiles based on developmental stages alone, or you can use combinations of anatomical structures and developmental stages.

    To ensure successful searches, the autocomplete list is limited to terms or stages for which GXD has the selected type of expression data.

    Three rows are provided by default. Use the Add structure button to specify up to 10 structures and/or developmental stages.

    The Expression Profile search does not compare gene expression levels between anatomical structures or Theiler stages, it only compares presence or absence of expression (Detected v. Not detected). For RNA-seq experiments, Not detected is defined as <0.5 TPM (below cutoff).

GXD Expression Profile Search
  1. Click on the --> RNA Seq Heat Map button (arrow) to open a browser window displaying your data in Morpheus, a tool created at the Broad Institute.

    Searches for expression data return summaries with multiple tabbed views, allowing users to review the returned data at their preferred level of detail. Heat maps are usually the most helpful way to review RNA-Seq data.

GXD Summary Heat Map Tab
  1. Use Morpheus to sort, filter, do hierarchical clustering, nearest neighbor analysis, and visual enrichment.

    A summary of the data exported to Morpheus is at the top of the page.

    Each column of the heat map is a bioreplicate set; the metadata annotations for the set are included in the column display.

    Each row in the heat map is a gene.

    A Tips box (inset indicated by arrow) provides guidance on interpreting the heat map and using Morpheus effectively.

Morpheus