| Category | ID | Term | DB Object | Evidence | Organism | Reference |
| Molecular Function | GO:0005515 | protein binding |
MGI:98823 | IPI | Mouse | MGI:MGI:2159489|PMID:11181534 |
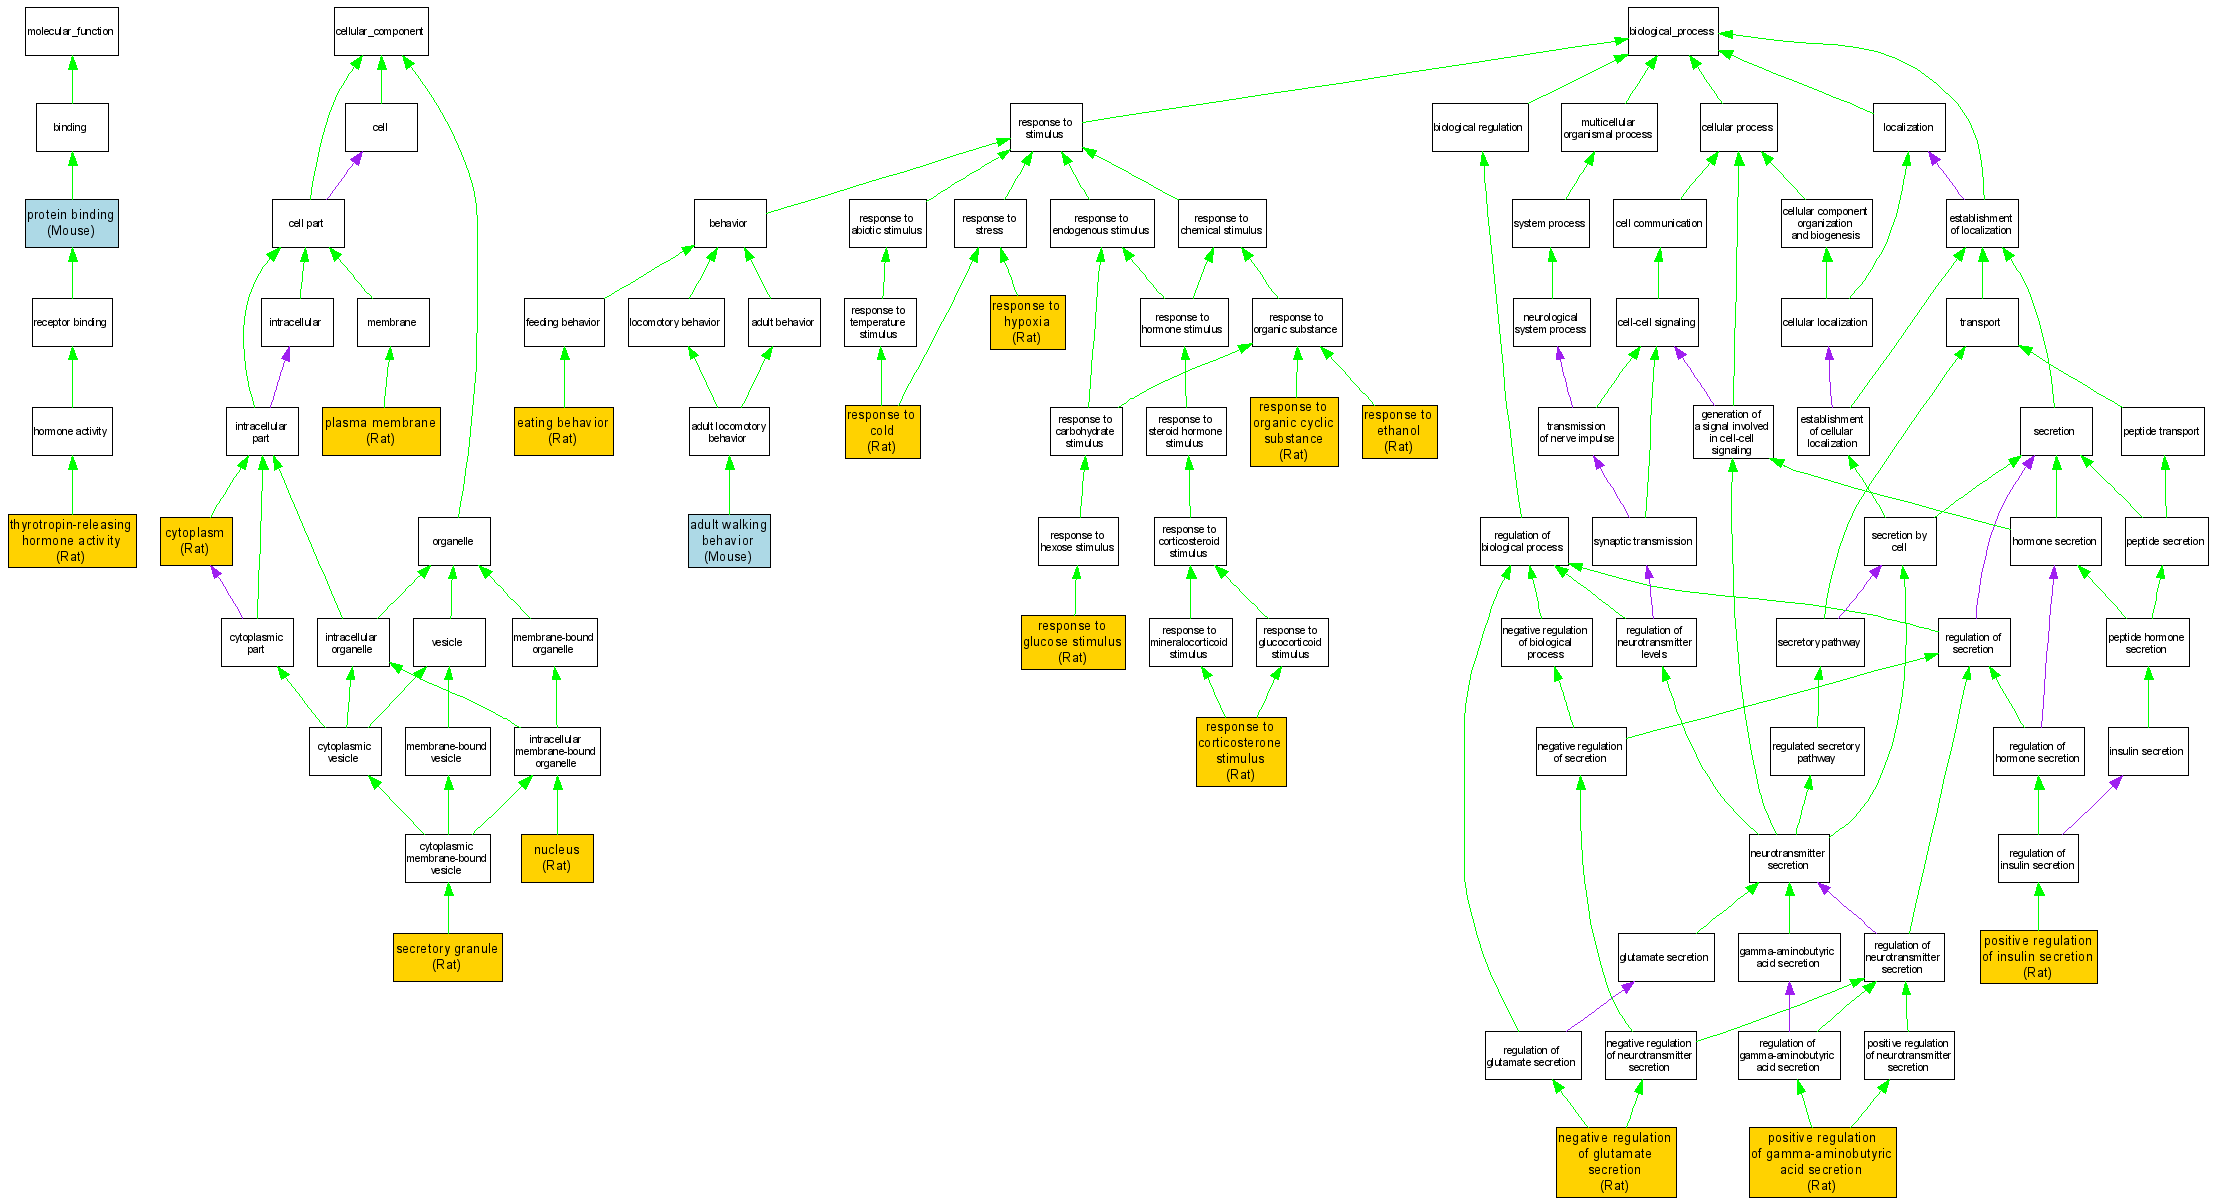
| Molecular Function | GO:0008437 | thyrotropin-releasing hormone activity |
RGD:3903 | IDA | Rat | RGD:634240|PMID:12369739 |
| Cellular Component | GO:0005737 | cytoplasm |
RGD:3903 | IDA | Rat | RGD:1600428|PMID:3930986 |
| Cellular Component | GO:0005634 | nucleus |
RGD:3903 | IDA | Rat | RGD:1600428|PMID:3930986 |
| Cellular Component | GO:0005886 | plasma membrane |
RGD:3903 | IDA | Rat | RGD:1600428|PMID:3930986 |
| Cellular Component | GO:0030141 | secretory granule |
RGD:3903 | IDA | Rat | RGD:1600428|PMID:3930986 |
| Biological Process | GO:0007628 | adult walking behavior |
MGI:98823 | IGI | Mouse | MGI:MGI:83622|PMID:8719807 |
| Biological Process | GO:0042755 | eating behavior |
RGD:3903 | IDA | Rat | RGD:1600409|PMID:16959836 |
| Biological Process | GO:0014050 | negative regulation of glutamate secretion |
RGD:3903 | IDA | Rat | RGD:1600422|PMID:16055093 |
| Biological Process | GO:0014054 | positive regulation of gamma-aminobutyric acid secretion |
RGD:3903 | IDA | Rat | RGD:1600408|PMID:16990402 |
| Biological Process | GO:0032024 | positive regulation of insulin secretion |
RGD:3903 | IDA | Rat | RGD:1600419|PMID:16118471 |
| Biological Process | GO:0009409 | response to cold |
RGD:3903 | IEP | Rat | RGD:1600416|PMID:16629836 |
| Biological Process | GO:0051412 | response to corticosterone stimulus |
RGD:3903 | IEP | Rat | RGD:1600418|PMID:16293347 |
| Biological Process | GO:0045471 | response to ethanol |
RGD:3903 | IEP | Rat | RGD:1600426|PMID:15680480 |
| Biological Process | GO:0009749 | response to glucose stimulus |
RGD:3903 | IEP | Rat | RGD:1600426|PMID:15680480 |
| Biological Process | GO:0001666 | response to hypoxia |
RGD:3903 | IEP | Rat | RGD:1600425|PMID:15726019 |
| Biological Process | GO:0014070 | response to organic cyclic substance |
RGD:3903 | IEP | Rat | RGD:1600421|PMID:16075386 |