| Category | ID | Term | DB Object | Evidence | Organism | Reference |
|---|---|---|---|---|---|---|
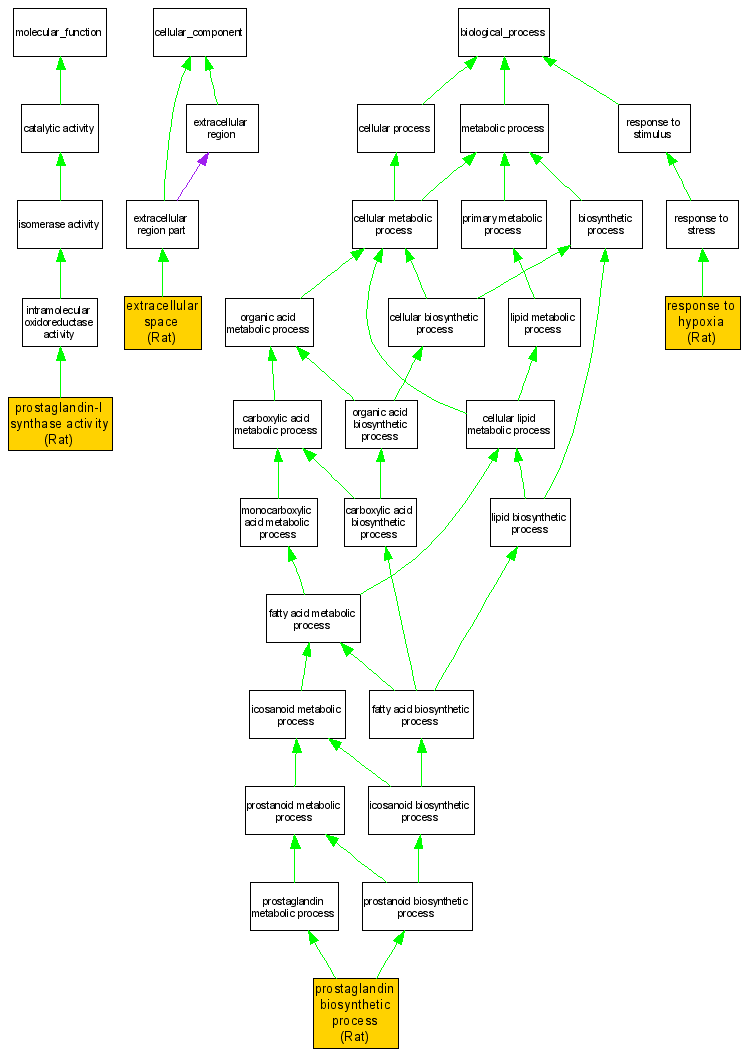
| Molecular Function | GO:0008116 | prostaglandin-I synthase activity | RGD:3438 | IMP | Rat | RGD:727270|PMID:10359560 |
| Molecular Function | GO:0008116 | prostaglandin-I synthase activity | RGD:3438 | IDA | Rat | RGD:1580667 |
| Cellular Component | GO:0005615 | extracellular space | RGD:3438 | IDA | Rat | RGD:1580695|PMID:15684702 |
| Biological Process | GO:0001516 | prostaglandin biosynthetic process | RGD:3438 | IDA | Rat | RGD:1580667 |
| Biological Process | GO:0001666 | response to hypoxia | RGD:3438 | IMP | Rat | RGD:1580667 |