Help


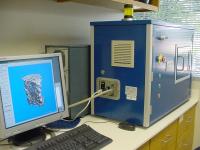
Test Description: The µCT40 scans dissected bones and provides detailed information on bone mass and architecture. Multiple bones are placed into sample holders and scanned automatically. The researcher than uses instrument software to select regions of interest for analysis. Trabecular bone parameters are analyzed in the fifth lumbar vertebrae (LV5) at 16 micrometer resolution and cortical bone parameters are analyzed in the femur midshaft at a resolution of 20 micrometers.


Results
Results
M-341
wt
M-320
wt
M-279
hom
M-293
hom
M-304
hom
M-310
hom

Results

Lumbar 5 Vertebra


Midshaft Femur


  MicroCT Data for Project: NIH-0769 - Results        Export Data to Spreadsheet
Mouse
Label
Genotype Age (days) Position Image Thumbnail Movie Sampno Measno VOX-TV VOX-BV VOX-BV/TV Conn-Dens TRI-SMI DT-Tb.N* DT-Tb.Th* DT-Tb.Sp* DT-Tb.(1/N).SD* DT-Tb.Th.SD* DT-Tb.Sp.SD* TRI-TV TRI-BV TRI-BV/TV TRI-BS TRI-BS/BV TRI-Tb.N TRI-Tb.Th TRI-Tb.Sp TRI-DA MeasNumSlices
M-279 hom 119 Femur View 17488 28693 0.8325 0.4746 26.25 0.0 1.221 0.0 0.0 0.0 0.0 0.0 0.0 1.148 0.452 0.393 3.135 6.936 1.365 0.288 0.444 8.842 20
M-279 hom 119 Vertebrae View 17488 28702 2.6808 0.7036 26.25 167.1135 1.0293 4.5766 0.0624 0.2251 0.1277 0.0188 0.1277 2.6062 0.6666 0.2558 23.8124 35.7222 4.5683 0.056 0.1629 1.7841 240
M-293 hom 119 Femur View 17491 28716 0.897 0.4854 20.11 0.0 0.923 0.0 0.0 0.0 0.0 0.0 0.0 1.322 0.462 0.35 3.418 7.384 1.292 0.27 0.502 6.083 20
M-293 hom 119 Vertebrae View 17491 28705 2.8412 0.5713 20.11 126.0018 1.9967 4.391 0.0596 0.2313 0.1256 0.0191 0.1256 2.7667 0.5231 0.1891 21.0633 40.2655 3.8066 0.0497 0.213 1.9326 240
M-304 hom 119 Femur View 17492 28717 0.9993 0.503 19.26 0.0 1.352 0.0 0.0 0.0 0.0 0.0 0.0 1.38 0.479 0.347 3.553 7.412 1.286 0.269 0.507 9.143 20
M-304 hom 119 Vertebrae View 17492 28706 3.1105 0.5991 19.26 113.0029 1.6591 4.4326 0.0562 0.2283 0.1128 0.0165 0.1128 3.0341 0.5546 0.1828 23.2002 41.8318 3.8233 0.0478 0.2137 2.1547 240
M-310 hom 118 Femur View 17489 28694 0.7356 0.385 11.56 0.0 1.122 0.0 0.0 0.0 0.0 0.0 0.0 1.071 0.367 0.342 3.081 8.39 1.437 0.238 0.457 9.087 20
M-310 hom 118 Vertebrae View 17489 28703 2.399 0.2774 11.56 77.9506 2.8497 4.7634 0.0433 0.2099 0.0927 0.0136 0.0927 2.3289 0.2252 0.0967 13.4312 59.6434 2.8835 0.0335 0.3133 1.7461 240
M-320 wt 118 Femur View 17493 28718 0.802 0.4399 13.75 0.0 1.311 0.0 0.0 0.0 0.0 0.0 0.0 1.219 0.419 0.343 3.141 7.494 1.287 0.266 0.509 10.164 20
M-320 wt 118 Vertebrae View 17493 28707 3.2853 0.4518 13.75 110.6428 2.0006 3.5458 0.0511 0.3202 0.1657 0.0156 0.1657 3.2059 0.4058 0.1266 19.4634 47.9672 3.0356 0.0417 0.2877 1.7206 240
M-341 wt 117 Femur View 17490 28695 0.8031 0.4376 20.48 0.0 1.319 0.0 0.0 0.0 0.0 0.0 0.0 1.148 0.417 0.363 3.132 7.512 1.364 0.266 0.466 10.564 20
M-341 wt 117 Vertebrae View 17490 28704 2.6072 0.534 20.48 148.6276 1.5815 4.4588 0.0563 0.2256 0.1204 0.0161 0.1204 2.5378 0.4947 0.1949 20.9169 42.2818 4.121 0.0473 0.1954 1.8826 240


Copyright 2005 by Lexicon Genetics Incorporated
Lexicon Phenotypic Analysis software version 05.05.00.05