Help


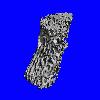
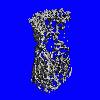
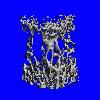
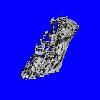
Test Description: The µCT40 scans dissected bones and provides detailed information on bone mass and architecture. Multiple bones are placed into sample holders and scanned automatically. The researcher than uses instrument software to select regions of interest for analysis. Trabecular 
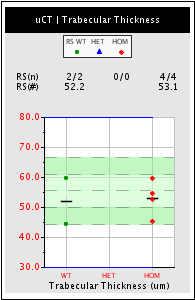
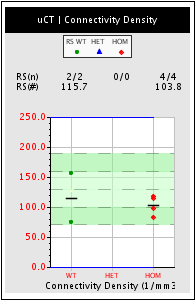
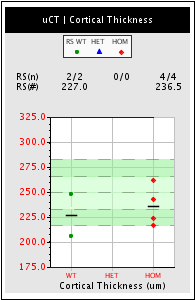
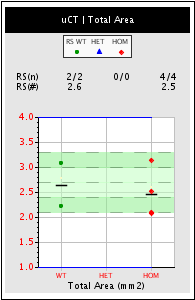
bone parameters are analyzed in the fifth lumbar vertebrae (LV5) at 16 micrometer resolution and cortical bone parameters are analyzed in the femur midshaft at a resolution of 20 micrometers.
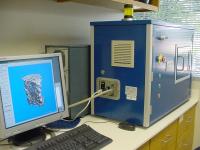


Results
Results
M-94
wt
M-62
wt
M-80
hom
M-81
hom
M-72
hom
M-73
hom

Results

Lumbar 5 Vertebra


Midshaft Femur


  MicroCT Data for Project: NIH-0824 - Results        Export Data to Spreadsheet
Mouse
Label
Genotype Age (days) Position Image Thumbnail Movie Sampno Measno VOX-TV VOX-BV VOX-BV/TV Conn-Dens TRI-SMI DT-Tb.N* DT-Tb.Th* DT-Tb.Sp* DT-Tb.(1/N).SD* DT-Tb.Th.SD* DT-Tb.Sp.SD* TRI-TV TRI-BV TRI-BV/TV TRI-BS TRI-BS/BV TRI-Tb.N TRI-Tb.Th TRI-Tb.Sp TRI-DA MeasNumSlices
M-72 hom 126 Femur View 2967 3748 0.589 0.341 17.72 0.0 1.192 0.0 0.0 0.0 0.0 0.0 0.0 0.86 0.325 0.378 2.67 8.208 1.552 0.243 0.4 11.598 20
M-72 hom 125 Vertebrae View 2967 3736 2.5471 0.4514 17.72 115.4248 2.0304 4.5583 0.0527 0.2195 0.1151 0.0158 0.1151 2.4734 0.404 0.1633 18.6703 46.2174 3.7742 0.0433 0.2217 1.7103 263
M-73 hom 126 Femur View 2968 3750 0.7711 0.3662 16.35 0.0 0.922 0.0 0.0 0.0 0.0 0.0 0.0 1.047 0.349 0.333 3.215 9.192 1.534 0.217 0.434 9.416 20
M-73 hom 125 Vertebrae View 2968 3737 3.2691 0.5344 16.35 118.8393 2.2997 4.2633 0.0547 0.2407 0.1372 0.0192 0.1372 3.189 0.4759 0.1492 21.6601 45.5185 3.3961 0.0439 0.2505 1.698 263
M-80 hom 131 Femur View 3001 3840 0.6754 0.3401 11.96 0.0 1.068 0.0 0.0 0.0 0.0 0.0 0.0 0.871 0.324 0.372 2.892 8.907 1.659 0.224 0.378 11.24 20
M-80 hom 126 Vertebrae View 3001 3776 2.4265 0.2903 11.96 83.2488 2.3568 3.7414 0.0454 0.2724 0.1425 0.0143 0.1425 2.3562 0.2467 0.1047 13.4483 54.5054 2.8538 0.0367 0.3137 1.6958 263
M-81 hom 131 Femur View 3000 3839 0.9704 0.4975 18.03 0.0 1.357 0.0 0.0 0.0 0.0 0.0 0.0 1.3 0.473 0.364 3.614 7.628 1.39 0.262 0.457 7.486 20
M-81 hom 126 Vertebrae View 3000 3775 2.3045 0.4155 18.03 97.6348 1.7455 3.6612 0.0596 0.28 0.153 0.0195 0.153 2.2481 0.3815 0.1697 14.8149 38.8366 3.2949 0.0515 0.252 1.6908 263
M-62 wt 128 Femur View 2966 3747 0.615 0.3043 10.18 0.0 1.019 0.0 0.0 0.0 0.0 0.0 0.0 0.92 0.29 0.315 2.816 9.683 1.529 0.206 0.447 10.452 20
M-62 wt 127 Vertebrae View 2966 3735 2.7195 0.2768 10.18 74.8298 2.6126 3.6314 0.0445 0.2814 0.1522 0.0145 0.1522 2.6461 0.2299 0.0869 13.1679 57.2683 2.4882 0.0349 0.367 1.6457 263
M-94 wt 131 Femur View 2999 3838 0.9111 0.4463 25.59 0.0 1.307 0.0 0.0 0.0 0.0 0.0 0.0 1.271 0.425 0.334 3.432 8.065 1.35 0.248 0.492 9.595 20
M-94 wt 126 Vertebrae View 2999 3774 4.3408 1.1107 25.59 156.5389 1.0748 5.2963 0.0598 0.1865 0.0791 0.0173 0.0791 4.2407 1.0696 0.2522 40.947 38.2834 4.8278 0.0522 0.1549 1.7163 263


Copyright 2005 by Lexicon Genetics Incorporated
Lexicon Phenotypic Analysis software version 05.05.00.05