Help

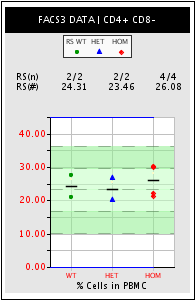
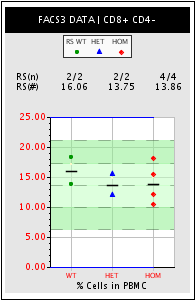
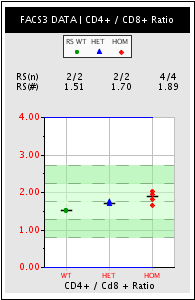
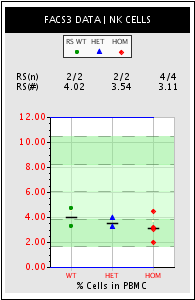
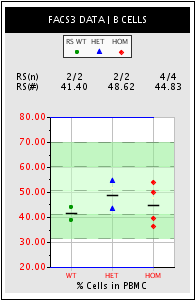
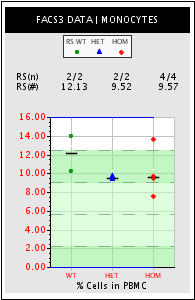
Test Description: The mononuclear cell profile is derived by staining a single sample of lysed peripheral blood from each mouse with a panel of six lineage-specific antibodies: CD45 PerCP, anti-TCRb APC, CD4 PE, CD8 FITC, pan-NK PE, and CD19 FITC. The two FITC and PE labeled antibodies stain mutually exclusive cell types. The samples are analyzed using a Becton Dickinson FACSCalibur flow cytometer with CellQuest software.


Results

TCRbeta+ T-Cells


TCRbeta- Cells


  FACS3 Analysis data for Project: NIH-0824 - Results        Export Data to Spreadsheet
Mouse
Label
Genotype Age (days) CD4+T CD8+T CD4+CD8+T CD4-CD8-T NK cells B cells Monocytes Image Thumbnail
M-82 het 117 20.2 11.98 0.56 0.6 3.16 54.2 9.34 None None
F-85 het 117 26.72 15.52 0.48 0.64 3.91 43.04 9.71 None None
M-72 hom 117 22.17 12.21 0.62 1.0 4.44 50.12 9.45 None None
M-73 hom 117 21.19 10.48 0.7 0.55 3.21 54.17 9.69 None None
F-84 hom 117 29.99 18.17 0.62 1.06 3.01 39.53 7.62 None None
F-86 hom 117 30.4 15.52 1.28 0.88 1.96 36.34 13.62 None None
F-77 wt 117 27.47 18.3 0.49 1.21 3.3 38.96 10.27 None None
M-94 wt 117 21.14 13.82 0.58 1.9 4.74 43.84 13.99 None None


Copyright 2005 by Lexicon Genetics Incorporated
Lexicon Phenotypic Analysis software version 05.05.00.05