Help


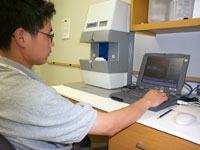
Test Description: Mice were anesthetized by intraperitoneal injection of Avertin (1.25% 2,2,2,-tribromoethanol, 20 ml/kg body weight ), measured body length and weight, and then placed in a prone position on the platform of the PIXImusTM Densitometer (Lunar Inc.) for a DEXA scan. Using a Lunar PIXImus software, the Bone mineral density (BMD) and fat composition (% fat) and total tissue mass (TTM) were determined in the regions of interest (ROI, i.e., whole body, vertebrae, and both femurs).


Results

  BMD = Bone Mineral Density (g/cm2);
  BMC = Bone Mineral Content (g);
  LBM = Lean Body Mass (g);
  BMC / LBM = BMC / LBM (mg/g);
  FAT(%) = % of Body FAT;
  FAT(g) = TTM X FAT(%)/100;
  TTM = Total Tissue Mass (g);
  vBMD = Volumetric BMD (mg/cm3)

MALE DATA


FEMALE DATA


DEXA Combined Gender Score
Parameter Score
Body BMD  N/A
Body vBMD  N/A
Body BMC/LBM  N/A
Femur BMD  N/A
Vertebral BMD  N/A
Total Tissue Mass  N/A
Body LBM  N/A
Body % Fat  N/A
Body Fat Content  N/A
The Combined Gender Score provides the average ration of Hom to WT values combining
males and females, with a correction factor for the number of mice in each group. No score
is generated if there are fewer than 4 HOM mice or fewer than 3 WT mice


DEXA Analysis: Male
Mouse Label Genotype Whole Body Vertebrae Femurs
BMD (g/cm2) BMC (g) TTM % FAT LBM (g) BMC / LBM (mg/g) vBMD (mg/cm3) BMD (g/cm2) BMD (g/cm2)
M-68wt0.05080.475326.9615.2222.3821.2416.610.06560.07685000
M-79wt0.04990.443728.1125.4920.521.6416.740.06070.07940000
M-100hom0.05110.495529.2917.2523.7420.8716.420.060.07510000
M-105hom0.05940.634135.1313.5529.7421.3218.180.06280.10179999
M-67hom0.04690.423630.2122.7122.9318.4815.610.0460.07000000
M-71hom0.0560.579132.4119.9525.3722.8317.420.06710.08464999
M-78hom0.05230.515130.2714.4525.3820.2916.660.05780.08295000
M-82hom0.0560.536330.4919.8623.922.4418.090.06250.08640000
M-89hom0.05030.460427.7314.9223.1319.916.620.04820.07590000
M-91hom0.05330.501430.3317.8924.420.5517.380.05730.08715000

DEXA Analysis: Female
Mouse Label Genotype Whole Body Vertebrae Femurs
BMD (g/cm2) BMC (g) TTM % FAT LBM (g) BMC / LBM (mg/g) vBMD (mg/cm3) BMD (g/cm2) BMD (g/cm2)
F-75wt0.05070.434521.1516.2617.2825.1517.320.06120.07105000
F-86wt0.05040.45222.0116.3917.9525.1816.830.05660.06970000
F-73het0.04890.420124.6421.3818.9522.1716.670.05980.07060000
F-85het0.0490.439523.8722.3318.124.2816.360.05320.06890000
F-95het0.04860.461420.9814.5917.4626.4315.780.05640.06355000
F-97het0.04970.462622.4317.718.025.716.30.06020.06795000


  DEXA Analysis data        Export Data to Spreadsheet
Mouse
Label
Genotype Age (days) Site BMD BMC Length Weight FAT TTM
F-73 het 110 T-Animal Total 0.0489 0.4201 9.4 25.75 21.38 24.64
F-73 het 110 R-V 0.0598 0.022 9.4 25.75 8.61 0.7
F-73 het 110 R-FL 0.0718 0.0288 9.4 25.75 21.31 0.69
F-73 het 110 R-FR 0.0694 0.0266 9.4 25.75 22.56 0.62
F-85 het 110 T-Animal Total 0.049 0.4395 9.3 27.85 22.33 23.87
F-85 het 110 R-FR 0.0678 0.0311 9.3 27.85 25.71 0.9
F-85 het 110 R-V 0.0532 0.0214 9.3 27.85 12.92 0.79
F-85 het 110 R-FL 0.07 0.0478 9.3 27.85 18.25 0.98
F-95 het 110 T-Animal Total 0.0486 0.4614 8.7 22.07 14.59 20.98
F-95 het 110 R-V 0.0564 0.0234 8.7 22.07 5.94 0.91
F-95 het 110 R-FR 0.0598 0.0293 8.7 22.07 11.46 0.64
F-95 het 110 R-FL 0.0673 0.0287 8.7 22.07 20.0 0.73
F-97 het 110 T-Animal Total 0.0497 0.4626 9.4 23.51 17.7 22.43
F-97 het 110 R-V 0.0602 0.0251 9.4 23.51 12.56 0.78
F-97 het 110 R-FR 0.0693 0.0302 9.4 23.51 22.3 0.76
F-97 het 110 R-FL 0.0666 0.0353 9.4 23.51 15.75 0.75
M-67 hom 110 T-Animal Total 0.0469 0.4236 9.5 30.7 22.71 30.21
M-67 hom 110 R-V 0.046 0.0166 9.5 30.7 11.99 0.81
M-67 hom 110 R-FL 0.0736 0.0278 9.5 30.7 22.05 0.78
M-67 hom 110 R-FR 0.0664 0.0279 9.5 30.7 22.04 0.85
M-71 hom 110 T-Animal Total 0.056 0.5791 9.7 33.3 19.95 32.41
M-71 hom 110 R-FR 0.0819 0.0356 9.7 33.3 15.57 0.88
M-71 hom 110 R-V 0.0671 0.0267 9.7 33.3 14.96 0.96
M-71 hom 110 R-FL 0.0874 0.0352 9.7 33.3 18.26 0.81
M-78 hom 110 T-Animal Total 0.0523 0.5151 9.9 31.34 14.45 30.27
M-78 hom 110 R-V 0.0578 0.0253 9.9 31.34 11.0 0.91
M-78 hom 110 R-FL 0.0813 0.0399 9.9 31.34 11.29 0.91
M-78 hom 110 R-FR 0.0846 0.0382 9.9 31.34 18.64 0.79
M-82 hom 110 T-Animal Total 0.056 0.5363 9.9 31.96 19.86 30.49
M-82 hom 110 R-V 0.0625 0.0256 9.9 31.96 11.76 0.82
M-82 hom 110 R-FL 0.0882 0.0398 9.9 31.96 21.23 0.94
M-82 hom 110 R-FR 0.0846 0.0378 9.9 31.96 17.04 0.89
M-89 hom 110 T-Animal Total 0.0503 0.4604 9.4 28.21 14.92 27.73
M-89 hom 110 R-FR 0.0736 0.0323 9.4 28.21 18.44 0.85
M-89 hom 110 R-V 0.0482 0.0185 9.4 28.21 7.6 1.0
M-89 hom 110 R-FL 0.0782 0.032 9.4 28.21 21.82 0.91
M-91 hom 110 T-Animal Total 0.0533 0.5014 9.8 30.92 17.89 30.33
M-91 hom 110 R-V 0.0573 0.024 9.8 30.92 8.29 0.85
M-91 hom 110 R-FL 0.0923 0.0406 9.8 30.92 21.61 0.8
M-91 hom 110 R-FR 0.082 0.0369 9.8 30.92 19.63 0.84
M-100 hom 109 T-Animal Total 0.0511 0.4955 9.6 30.49 17.25 29.29
M-100 hom 109 R-V 0.06 0.026 9.6 30.49 9.08 1.09
M-100 hom 109 R-FR 0.0717 0.0321 9.6 30.49 13.72 0.79
M-100 hom 109 R-FL 0.0785 0.0326 9.6 30.49 19.91 0.81
M-105 hom 109 T-Animal Total 0.0594 0.6341 10.2 36.61 13.55 35.13
M-105 hom 109 R-V 0.0628 0.0262 10.2 36.61 9.61 1.06
M-105 hom 109 R-FR 0.0984 0.0446 10.2 36.61 13.39 0.83
M-105 hom 109 R-FL 0.1052 0.0426 10.2 36.61 13.81 0.81
M-68 wt 110 T-Animal Total 0.0508 0.4753 9.4 27.84 15.22 26.96
M-68 wt 110 R-V 0.0656 0.0252 9.4 27.84 5.9 0.78
M-68 wt 110 R-FR 0.0764 0.0299 9.4 27.84 14.48 0.71
M-68 wt 110 R-FL 0.0773 0.0347 9.4 27.84 12.43 0.73
F-75 wt 110 T-Animal Total 0.0507 0.4345 8.9 21.99 16.26 21.15
F-75 wt 110 R-V 0.0612 0.0263 8.9 21.99 7.55 0.85
F-75 wt 110 R-FR 0.0716 0.0287 8.9 21.99 17.35 0.7
F-75 wt 110 R-FL 0.0705 0.0293 8.9 21.99 16.16 0.77
M-79 wt 110 T-Animal Total 0.0499 0.4437 9.4 28.54 25.49 28.11
M-79 wt 110 R-FR 0.0785 0.0298 9.4 28.54 22.57 0.82
M-79 wt 110 R-FL 0.0803 0.0323 9.4 28.54 24.1 0.84
M-79 wt 110 R-V 0.0607 0.0252 9.4 28.54 14.6 0.89
F-86 wt 110 R-FL 0.0706 0.0293 9.3 22.7 21.39 0.69
F-86 wt 110 R-V 0.0566 0.0226 9.3 22.7 5.86 0.79
F-86 wt 110 T-Animal Total 0.0504 0.452 9.3 22.7 16.39 22.01
F-86 wt 110 R-FR 0.0688 0.0286 9.3 22.7 17.29 0.72


Copyright 2005 by Lexicon Genetics Incorporated
Lexicon Phenotypic Analysis software version 05.05.00.05