Help


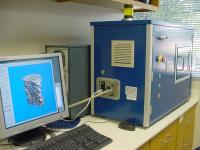
Test Description: The µCT40 scans dissected bones and provides detailed information on bone mass and architecture. Multiple bones are placed into sample holders and scanned automatically. The researcher than uses instrument software to select regions of interest for analysis. Trabecular bone parameters are analyzed in the fifth lumbar vertebrae (LV5) at 16 micrometer resolution and cortical bone parameters are analyzed in the femur midshaft at a resolution of 20 micrometers.


Results
Results
M-55
wt
M-69
wt
M-114
het
M-87
het
M-92
het
M-99
het

Results

Lumbar 5 Vertebra


Midshaft Femur


  MicroCT Data for Project: NIH-0129 - Results        Export Data to Spreadsheet
Mouse
Label
Genotype Age (days) Position Image Thumbnail Movie SampNo MeasNo VOX-TV VOX-BV VOX-BV/TV Conn-Dens. TRI-SMI DT-Tb.N* DT-Tb.Th* DT-Tb.Sp* DT-Tb.(1/N).SD* DT-Tb.Th.SD* DT-Tb.Sp.SD* TRI-TV TRI-BV TRI-BV/TV TRI-BS TRI-BS/BV TRI-Tb.N TRI-Tb.Th TRI-Tb.Sp TRI-DA MeasNumSlices
M-87 het 116 Femur View 12566 19620 0.8888 0.4093 20.97 0.0 1.124 0.0 0.0 0.0 0.0 0.0 0.0 1.322 0.39 0.295 3.39 8.681 1.281 0.23 0.549 9.577 20
M-87 het 118 Vertebrae View 12566 19722 3.0617 0.6421 20.97 146.8143 1.7706 4.4193 0.0582 0.2315 0.1481 0.0183 0.1481 2.9827 0.5929 0.1988 24.45 41.2389 4.0987 0.0485 0.1955 1.864 240
M-92 het 116 Femur View 12567 19621 0.8421 0.431 18.04 0.0 1.23 0.0 0.0 0.0 0.0 0.0 0.0 1.271 0.41 0.323 3.265 7.949 1.284 0.251 0.527 9.112 20
M-92 het 118 Vertebrae View 12567 19724 2.1971 0.3963 18.04 150.881 2.0616 5.2282 0.0509 0.1931 0.0786 0.0155 0.0786 2.1355 0.3508 0.1643 16.705 47.6257 3.9113 0.042 0.2137 1.6162 240
M-99 het 116 Femur View 12563 19617 0.7665 0.4147 16.72 0.0 1.27 0.0 0.0 0.0 0.0 0.0 0.0 1.103 0.395 0.358 3.028 7.665 1.372 0.26 0.467 10.844 20
M-99 het 113 Vertebrae View 12563 19590 2.7493 0.4596 16.72 101.299 2.1289 4.2203 0.0537 0.2387 0.1308 0.0164 0.1308 2.6758 0.4109 0.1536 18.5092 45.0401 3.4587 0.0444 0.2447 1.8496 240
M-114 het 114 Femur View 12564 19618 0.6872 0.3668 19.37 0.0 1.13 0.0 0.0 0.0 0.0 0.0 0.0 0.951 0.349 0.367 2.879 8.234 1.513 0.242 0.418 10.758 20
M-114 het 111 Vertebrae View 12564 19591 2.7597 0.5346 19.37 151.6494 1.8043 4.6304 0.0533 0.2193 0.1205 0.016 0.1205 2.6856 0.4833 0.18 21.8519 45.212 4.0684 0.0442 0.2016 1.9187 240
M-55 wt 118 Femur View 12565 19619 0.6967 0.3209 11.36 0.0 1.047 0.0 0.0 0.0 0.0 0.0 0.0 0.951 0.306 0.322 3.022 9.849 1.588 0.203 0.426 11.286 20
M-55 wt 120 Vertebrae View 12565 19786 2.9498 0.3352 11.36 86.9543 2.559 3.669 0.0442 0.2783 0.1725 0.0138 0.1725 2.8713 0.2786 0.097 16.067 57.6753 2.7979 0.0347 0.3227 1.846 240
M-69 wt 116 Femur View 12562 19616 0.6543 0.3612 13.72 0.0 1.221 0.0 0.0 0.0 0.0 0.0 0.0 0.951 0.344 0.362 2.852 8.277 1.498 0.241 0.425 10.049 20
M-69 wt 113 Vertebrae View 12562 19589 2.6274 0.3605 13.72 102.5737 2.2888 3.7696 0.0494 0.2697 0.1564 0.0158 0.1564 2.5574 0.3128 0.1223 15.7519 50.3599 3.0796 0.0397 0.285 1.7845 240


Copyright 2005 by Lexicon Genetics Incorporated
Lexicon Phenotypic Analysis software version 05.05.00.05