Test Description: Additional blood tests are carried out by Abbott's
Cell-Dyn 3500R, an automated hematology analyzer. Some of its features include
a five-part WBC differential. 'Patient' reports can cover over 22 parameters in all.
Results
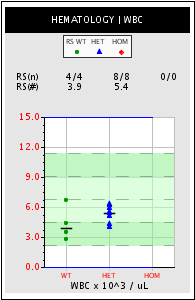
WBC
=
White Blood Cell Count
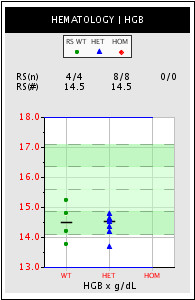
HGB
=
HemoGloBin
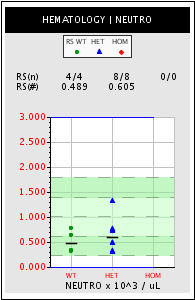
NEUTRO
=
NEUTROphil
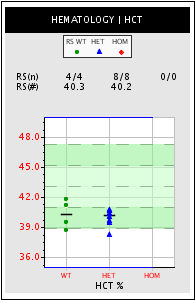
HCT
=
HematoCriT
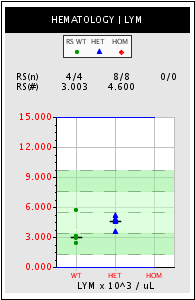
LYM
=
LYMphocyte
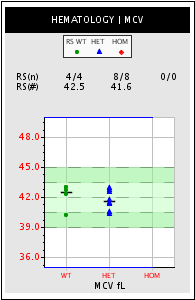
MCV
=
Mean Corpuscular Volume
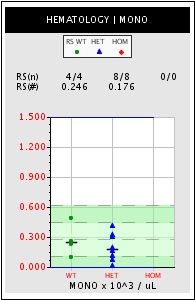
MONO
=
MONOcyte
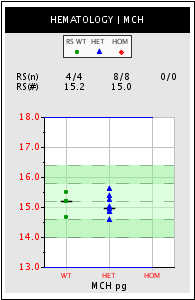
MCH
=
Mean Corpuscular Hemoglobin
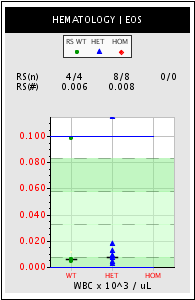
EOS
=
EOSinophil
MCHC
=
Mean Corpuscular Hemoglobin Concentration
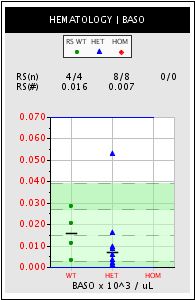
BASO
=
BASOphil
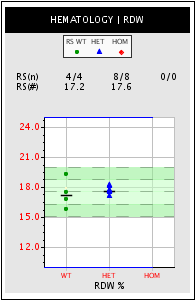
RDW
=
Red Cell Distribution Width
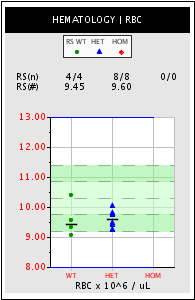
RBC
=
Red Blood Cell Count
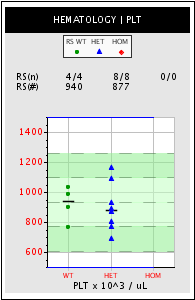
PLT
=
PLateLet
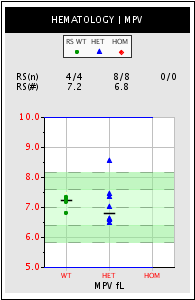
MPV
=
Mean Platelet Volume
Copyright 2005 by Lexicon Genetics Incorporated Lexicon Phenotypic Analysis software version 05.05.00.05