Help


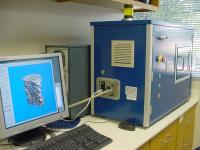
Test Description: The µCT40 scans dissected bones and provides detailed information on bone mass and architecture. Multiple bones are placed into sample holders and scanned automatically. The researcher than uses instrument software to select regions of interest for analysis. Trabecular bone parameters are analyzed in the fifth lumbar vertebrae (LV5) at 16 micrometer resolution and cortical bone parameters are analyzed in the femur midshaft at a resolution of 20 micrometers.


Results
Results
M-55
wt
M-109
wt
M-54
hom
M-107
hom
M-110
hom

Results

Lumbar 5 Vertebra


Midshaft Femur


  MicroCT Data for Project: NIH-0195 - Results        Export Data to Spreadsheet
Mouse
Label
Genotype Age (days) Position Image Thumbnail Movie SampNo MeasNo VOX-TV VOX-BV VOX-BV/TV Conn-Dens. TRI-SMI DT-Tb.N* DT-Tb.Th* DT-Tb.Sp* DT-Tb.(1/N).SD* DT-Tb.Th.SD* DT-Tb.Sp.SD* TRI-TV TRI-BV TRI-BV/TV TRI-BS TRI-BS/BV TRI-Tb.N TRI-Tb.Th TRI-Tb.Sp TRI-DA MeasNumSlices
M-54 hom 127 Femur View 3050 3938 0.9397 0.4856 22.72 0.0 1.069 0.0 0.0 0.0 0.0 0.0 0.0 1.373 0.462 0.336 3.484 7.529 1.268 0.265 0.522 8.399 20
M-54 hom 126 Vertebrae View 3050 3901 3.9245 0.8916 22.72 149.0637 1.4703 4.272 0.0594 0.2416 0.1593 0.0181 0.1593 3.8327 0.8373 0.2185 33.1013 39.5312 4.3183 0.0506 0.181 1.7619 263
M-107 hom 126 Femur View 3052 3940 0.8112 0.4703 22.54 0.0 0.772 0.0 0.0 0.0 0.0 0.0 0.0 1.215 0.448 0.369 3.207 7.152 1.319 0.279 0.478 9.367 20
M-107 hom 125 Vertebrae View 3052 3905 3.1056 0.7 22.54 123.9677 1.3266 4.1845 0.0633 0.2405 0.1193 0.0194 0.1193 3.0279 0.6634 0.2191 24.4227 36.8128 4.0329 0.0543 0.1936 1.9465 263
M-110 hom 128 Femur View 3087 4015 0.7303 0.3684 16.14 0.0 1.123 0.0 0.0 0.0 0.0 0.0 0.0 1.071 0.351 0.327 3.065 8.72 1.429 0.229 0.47 10.803 20
M-110 hom 127 Vertebrae View 3087 3966 2.9199 0.4712 16.14 132.5366 1.989 3.8807 0.0506 0.2627 0.1604 0.0165 0.1604 2.8436 0.4193 0.1475 20.0225 47.7514 3.5206 0.0419 0.2422 1.7188 263
M-55 wt 127 Femur View 3051 3939 1.0252 0.5461 25.83 0.0 1.37 0.0 0.0 0.0 0.0 0.0 0.0 1.487 0.519 0.349 3.58 6.887 1.203 0.29 0.54 7.643 20
M-55 wt 126 Vertebrae View 3051 3902 3.568 0.9216 25.83 186.3766 1.3655 4.9743 0.0625 0.2035 0.1153 0.0198 0.1153 3.4826 0.8726 0.2506 32.3029 37.0193 4.6378 0.054 0.1616 1.7147 263
M-109 wt 126 Femur View 3037 3900 0.6941 0.3915 18.06 0.0 1.207 0.0 0.0 0.0 0.0 0.0 0.0 1.005 0.373 0.371 2.914 7.81 1.449 0.256 0.433 9.824 20
M-109 wt 125 Vertebrae View 3037 3884 2.7217 0.4914 18.06 138.149 2.0276 4.3686 0.0549 0.2301 0.1178 0.0175 0.1178 2.6435 0.4407 0.1667 19.6213 44.5248 3.7112 0.0449 0.2245 1.7719 263


Copyright 2005 by Lexicon Genetics Incorporated
Lexicon Phenotypic Analysis software version 05.05.00.05