Help


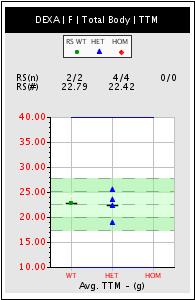
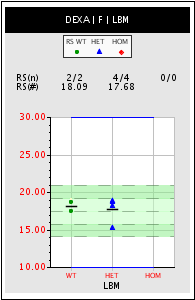
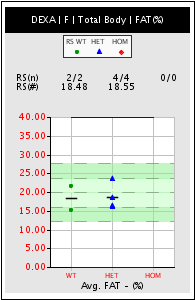
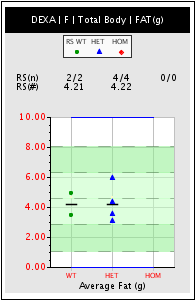
Test Description: Mice were anesthetized by intraperitoneal injection of Avertin (1.25% 2,2,2,-tribromoethanol, 20 ml/kg body weight ), measured body length and weight, and then placed in a prone position on the 
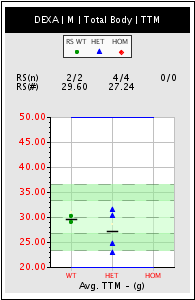
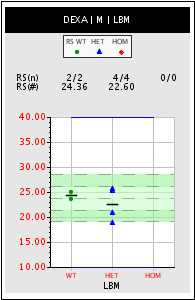
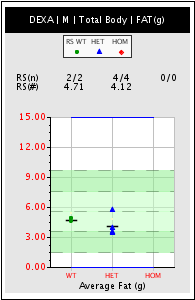
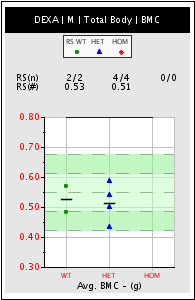
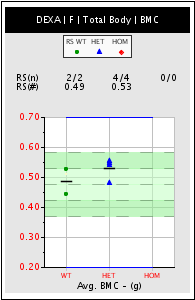
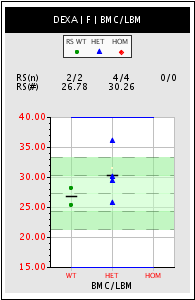
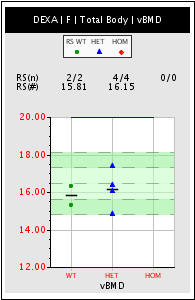
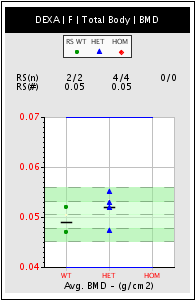
platform of the PIXImusTM Densitometer (Lunar Inc.) for a DEXA scan. 
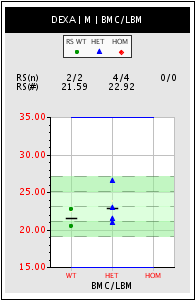
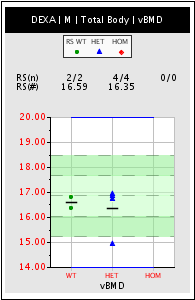
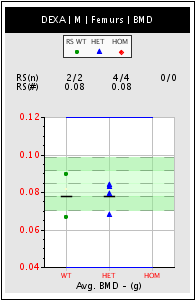
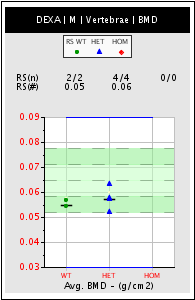
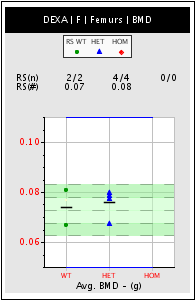
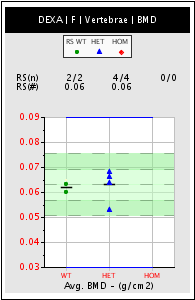
Using a Lunar PIXImus software, the Bone mineral density (BMD) and fat composition (% fat) and total tissue mass (TTM) were determined in the regions of interest (ROI, i.e., whole body, vertebrae, and both femurs).
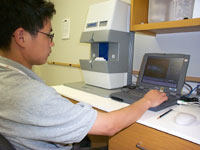
Assay-Specific Summary :NIH-1841
Results
DEXA: No notable difference.

Results

  BMD = Bone Mineral Density (g/cm2);
  BMC = Bone Mineral Content (g);
  LBM = Lean Body Mass (g);
  BMC / LBM = BMC / LBM (mg/g);
  FAT(%) = % of Body FAT;
  FAT(g) = TTM X FAT(%)/100;
  TTM = Total Tissue Mass (g);
  vBMD = Volumetric BMD (mg/cm3)

MALE DATA


FEMALE DATA


DEXA Combined Gender Score
Parameter Score
Body BMD  0.0%
Body vBMD  0.0%
Body BMC/LBM  0.0%
Femur BMD  N/A
Vertebral BMD  0.0%
Total Tissue Mass  0.0%
Body LBM  0.0%
Body % Fat  0.0%
Body Fat Content  0.0%
The Combined Gender Score provides the average ration of Hom to WT values combining
males and females, with a correction factor for the number of mice in each group. No score
is generated if there are fewer than 4 HOM mice or fewer than 3 WT mice


DEXA Analysis: Male
Mouse Label Genotype Whole Body Vertebrae Femurs
BMD (g/cm2) BMC (g) TTM % FAT LBM (g) BMC / LBM (mg/g) vBMD (mg/cm3) BMD (g/cm2) BMD (g/cm2)
M-108wt0.05060.484328.9916.7823.6420.4916.370.05420.07285000
M-79wt0.05440.569330.2115.0825.0922.6916.810.05670.08880000
M-104het0.05520.586430.1112.8325.6622.8516.930.0630.08425000
M-107het0.05320.538931.3418.0325.1521.4316.720.05750.08250000
M-115het0.04590.434224.613.9120.7420.9314.930.05190.07005000
M-124het0.05210.498722.8915.5218.8426.4716.840.05720.07890000

DEXA Analysis: Female
Mouse Label Genotype Whole Body Vertebrae Femurs
BMD (g/cm2) BMC (g) TTM % FAT LBM (g) BMC / LBM (mg/g) vBMD (mg/cm3) BMD (g/cm2) BMD (g/cm2)
F-102wt0.0470.443422.8421.6517.4525.4115.310.05990.07025000
F-121wt0.0520.527422.7415.3118.7328.1616.320.06320.07615000
F-130het0.05180.540622.1716.0618.0729.9216.030.06360.07765000
F-83het0.0550.552325.3323.5118.8229.3417.360.06780.07995000
F-91het0.05270.546818.7716.2715.1736.0516.360.0660.07950000
F-95het0.04730.479923.4318.3618.6525.7314.850.0530.07015000


  DEXA Analysis data Export Data to Spreadsheet
Mouse
Label
Genotype Age (days) Site BMD BMC Length Weight FAT TTM
F-83 het 100 T-Animal Total 0.055 0.5523 9.4 26.54 23.51 25.33
F-83 het 100 R-V 0.0678 0.0273 9.4 26.54 12.53 1.0
F-83 het 100 R-FL 0.0815 0.0334 9.4 26.54 26.59 0.62
F-83 het 100 R-FR 0.0784 0.0355 9.4 26.54 19.41 0.58
F-91 het 100 T-Animal Total 0.0527 0.5468 8.7 20.25 16.27 18.77
F-91 het 100 R-V 0.066 0.0326 8.7 20.25 5.12 0.97
F-91 het 100 R-FL 0.0818 0.0273 8.7 20.25 17.07 0.41
F-91 het 100 R-FR 0.0772 0.0303 8.7 20.25 13.35 0.4
F-95 het 99 T-Animal Total 0.0473 0.4799 9.2 24.72 18.36 23.43
F-95 het 99 R-V 0.053 0.0201 9.2 24.72 5.37 0.89
F-95 het 99 R-FL 0.0732 0.028 9.2 24.72 24.88 0.61
F-95 het 99 R-FR 0.0671 0.0283 9.2 24.72 17.33 0.56
M-104 het 98 T-Animal Total 0.0552 0.5864 10.2 31.58 12.83 30.11
M-104 het 98 R-V 0.063 0.0302 10.2 31.58 6.5 1.21
M-104 het 98 R-FL 0.0847 0.0369 10.2 31.58 15.27 0.72
M-104 het 98 R-FR 0.0838 0.0379 10.2 31.58 9.11 0.7
M-107 het 98 T-Animal Total 0.0532 0.5389 10.2 32.58 18.03 31.34
M-107 het 98 R-FR 0.0792 0.0372 10.2 32.58 18.24 0.8
M-107 het 98 R-V 0.0575 0.0245 10.2 32.58 7.42 1.16
M-107 het 98 R-FL 0.0858 0.0369 10.2 32.58 19.77 0.82
M-115 het 97 T-Animal Total 0.0459 0.4342 9.3 25.78 13.91 24.6
M-115 het 97 R-FR 0.0676 0.0285 9.3 25.78 10.39 0.61
M-115 het 97 R-V 0.0519 0.0208 9.3 25.78 5.72 0.96
M-115 het 97 R-FL 0.0725 0.0264 9.3 25.78 13.5 0.6
M-124 het 97 R-FL 0.0824 0.0272 9.3 24.45 14.54 0.55
M-124 het 97 R-V 0.0572 0.0239 9.3 24.45 4.38 0.87
M-124 het 97 R-FR 0.0754 0.0283 9.3 24.45 9.64 0.44
M-124 het 97 T-Animal Total 0.0521 0.4987 9.3 24.45 15.52 22.89
F-130 het 96 T-Animal Total 0.0518 0.5406 8.9 23.6 16.06 22.17
F-130 het 96 R-V 0.0636 0.0263 8.9 23.6 6.92 0.89
F-130 het 96 R-FR 0.0756 0.0308 8.9 23.6 12.38 0.43
F-130 het 96 R-FL 0.0797 0.0295 8.9 23.6 21.5 0.48
M-79 wt 100 T-Animal Total 0.0544 0.5693 10.0 31.48 15.08 30.21
M-79 wt 100 R-V 0.0567 0.019 10.0 31.48 7.11 0.88
M-79 wt 100 R-FL 0.0898 0.0426 10.0 31.48 18.66 0.81
M-79 wt 100 R-FR 0.0878 0.0409 10.0 31.48 9.28 0.66
F-102 wt 99 R-FR 0.0666 0.0266 9.0 24.05 18.24 0.5
F-102 wt 99 R-FL 0.0739 0.0282 9.0 24.05 25.31 0.59
F-102 wt 99 R-V 0.0599 0.0209 9.0 24.05 9.74 0.8
F-102 wt 99 T-Animal Total 0.047 0.4434 9.0 24.05 21.65 22.84
M-108 wt 98 T-Animal Total 0.0506 0.4843 9.3 30.15 16.78 28.99
M-108 wt 98 R-V 0.0542 0.0241 9.3 30.15 8.45 1.19
M-108 wt 98 R-FR 0.0668 0.0294 9.3 30.15 15.79 0.77
M-108 wt 98 R-FL 0.0789 0.0307 9.3 30.15 21.93 0.76
F-121 wt 97 R-V 0.0632 0.0246 9.1 24.11 6.29 1.07
F-121 wt 97 T-Animal Total 0.052 0.5274 9.1 24.11 15.31 22.74
F-121 wt 97 R-FL 0.0808 0.0293 9.1 24.11 21.37 0.56
F-121 wt 97 R-FR 0.0715 0.0306 9.1 24.11 14.72 0.55
 

Confidential Information

Copyright 2006 by Lexicon Genetics Incorporated