Help


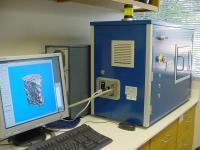
Test Description: The µCT40 scans dissected bones and provides detailed information on bone mass and architecture. Multiple bones are placed into sample holders and scanned automatically. The researcher than uses instrument software to select regions of interest for analysis. Trabecular bone parameters are analyzed in the fifth lumbar vertebrae (LV5) at 16 micrometer resolution and cortical bone parameters are analyzed in the femur midshaft at a resolution of 20 micrometers.


Results
Results
M-143
wt
M-150
wt
M-122
hom
M-127
hom
M-130
hom
M-135
hom

Results

Lumbar 5 Vertebra


Midshaft Femur


  MicroCT Data for Project: NIH-1790 - Results        Export Data to Spreadsheet
Mouse
Label
Genotype Age (days) Position Image Thumbnail Movie Sampno Measno VOX-TV VOX-BV VOX-BV/TV Conn-Dens TRI-SMI DT-Tb.N* DT-Tb.Th* DT-Tb.Sp* DT-Tb.(1/N).SD* DT-Tb.Th.SD* DT-Tb.Sp.SD* TRI-TV TRI-BV TRI-BV/TV TRI-BS TRI-BS/BV TRI-Tb.N TRI-Tb.Th TRI-Tb.Sp TRI-DA MeasNumSlices
M-122 hom 115 Femur View 10296 15822 0.5929 0.3131 14.85 0.0 1.11 0.0 0.0 0.0 0.0 0.0 0.0 0.836 0.299 0.357 2.69 8.999 1.609 0.222 0.399 12.176 20
M-122 hom 116 Vertebrae View 10296 15933 2.6329 0.3909 14.85 121.7272 2.1827 4.1319 0.0479 0.246 0.1248 0.0147 0.1248 2.5561 0.3386 0.1325 17.1883 50.7632 3.3622 0.0394 0.258 1.6446 240
M-127 hom 114 Femur View 10295 15821 0.7139 0.3403 16.09 0.0 1.046 0.0 0.0 0.0 0.0 0.0 0.0 1.065 0.324 0.304 3.014 9.279 1.414 0.215 0.491 10.428 20
M-127 hom 115 Vertebrae View 10295 15932 3.1374 0.5047 16.09 142.1548 2.01 4.548 0.0467 0.2231 0.1038 0.0143 0.1038 3.053 0.4454 0.1459 23.072 51.7985 3.7785 0.0386 0.226 1.6825 240
M-130 hom 114 Femur View 10294 15820 0.6233 0.3319 10.31 0.0 1.121 0.0 0.0 0.0 0.0 0.0 0.0 0.898 0.316 0.352 2.773 8.756 1.543 0.228 0.419 10.319 20
M-130 hom 115 Vertebrae View 10294 15931 3.3592 0.3464 10.31 71.8914 2.2957 3.3266 0.0447 0.3079 0.1654 0.014 0.1654 3.2755 0.2979 0.0909 16.6432 55.8693 2.5406 0.0358 0.3578 1.6118 240
M-135 hom 114 Femur View 10293 15819 0.7298 0.3677 12.84 0.0 1.124 0.0 0.0 0.0 0.0 0.0 0.0 1.047 0.35 0.334 3.004 8.566 1.433 0.233 0.464 11.031 20
M-135 hom 115 Vertebrae View 10293 15930 3.1118 0.3997 12.84 91.9076 2.2149 3.5719 0.0473 0.2876 0.1806 0.0143 0.1806 3.0338 0.352 0.116 18.6797 53.0655 3.0786 0.0377 0.2871 1.775 240
M-143 wt 114 Femur View 10292 15815 0.6484 0.3331 11.1 0.0 1.095 0.0 0.0 0.0 0.0 0.0 0.0 0.898 0.318 0.354 2.87 9.024 1.598 0.221 0.404 11.672 20
M-143 wt 115 Vertebrae View 10292 15929 2.4102 0.2675 11.1 80.6992 2.4406 3.8573 0.0423 0.2641 0.1284 0.0134 0.1284 2.3425 0.2212 0.0944 12.8201 57.9453 2.7364 0.0345 0.3309 1.6445 240
M-150 wt 114 Femur View 10297 15823 0.755 0.4008 19.63 0.0 1.34 0.0 0.0 0.0 0.0 0.0 0.0 1.059 0.382 0.36 3.047 7.974 1.439 0.25 0.444 9.439 20
M-150 wt 115 Vertebrae View 10297 15934 2.835 0.5564 19.63 165.2558 1.7504 4.5071 0.0523 0.2243 0.113 0.0159 0.113 2.758 0.5055 0.1833 22.8219 45.144 4.1373 0.0443 0.1974 1.6456 240


Copyright 2005 by Lexicon Genetics Incorporated
Lexicon Phenotypic Analysis software version 05.05.00.05