 Results for Cellular Component Bins:
Category Count Percentage All MGI
Golgi apparatus 0 0.00000 242 0.02347
cell projection 0 0.00000 930 0.09020
cytoplasmic vesicle 1 0.01299 351 0.03404
cytoskeleton 1 0.01299 468 0.04539
cytosol 0 0.00000 419 0.04064
endoplasmic reticulum 0 0.00000 353 0.03424
endosome 0 0.00000 170 0.01649
extracellular region 0 0.00000 598 0.05800
mitochondrion 6 0.07792 1238 0.12008
non-membrane-bounded organelle 13 0.16883 1035 0.10039
nucleus 40 0.51948 1963 0.19040
organelle envelope 1 0.01299 297 0.02881
organelle lumen 15 0.19481 509 0.04937
plasma membrane 0 0.00000 1315 0.12755
synapse 0 0.00000 314 0.03046
vacuole 0 0.00000 108 0.01048
Results for Cellular Component Bins:
Category Count Percentage All MGI
Golgi apparatus 0 0.00000 242 0.02347
cell projection 0 0.00000 930 0.09020
cytoplasmic vesicle 1 0.01299 351 0.03404
cytoskeleton 1 0.01299 468 0.04539
cytosol 0 0.00000 419 0.04064
endoplasmic reticulum 0 0.00000 353 0.03424
endosome 0 0.00000 170 0.01649
extracellular region 0 0.00000 598 0.05800
mitochondrion 6 0.07792 1238 0.12008
non-membrane-bounded organelle 13 0.16883 1035 0.10039
nucleus 40 0.51948 1963 0.19040
organelle envelope 1 0.01299 297 0.02881
organelle lumen 15 0.19481 509 0.04937
plasma membrane 0 0.00000 1315 0.12755
synapse 0 0.00000 314 0.03046
vacuole 0 0.00000 108 0.01048
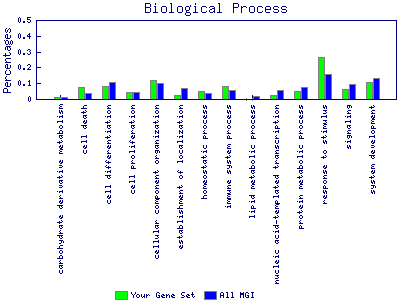
 Results for Biological Process Bins:
Category Count Percentage All MGI
carbohydrate derivative metabolism 2 0.01136 326 0.01392
cell death 13 0.07386 816 0.03485
cell differentiation 14 0.07955 2499 0.10673
cell proliferation 8 0.04545 1039 0.04437
cellular component organization 21 0.11932 2399 0.10246
establishment of localization 4 0.02273 1569 0.06701
homeostatic process 9 0.05114 829 0.03540
immune system process 15 0.08523 1278 0.05458
lipid metabolic process 0 0.00000 458 0.01956
nucleic acid-templated transcription 4 0.02273 1358 0.05800
protein metabolic process 9 0.05114 1748 0.07465
response to stimulus 47 0.26705 3650 0.15588
signaling 11 0.06250 2269 0.09690
system development 19 0.10795 3177 0.13568
Results for Biological Process Bins:
Category Count Percentage All MGI
carbohydrate derivative metabolism 2 0.01136 326 0.01392
cell death 13 0.07386 816 0.03485
cell differentiation 14 0.07955 2499 0.10673
cell proliferation 8 0.04545 1039 0.04437
cellular component organization 21 0.11932 2399 0.10246
establishment of localization 4 0.02273 1569 0.06701
homeostatic process 9 0.05114 829 0.03540
immune system process 15 0.08523 1278 0.05458
lipid metabolic process 0 0.00000 458 0.01956
nucleic acid-templated transcription 4 0.02273 1358 0.05800
protein metabolic process 9 0.05114 1748 0.07465
response to stimulus 47 0.26705 3650 0.15588
signaling 11 0.06250 2269 0.09690
system development 19 0.10795 3177 0.13568
To download as an Excel file, right click and "Save Link As..."